Time Series Databases
This guide describes what a Time Series Database (TSDB) is, the solution adopted by Healthbot and demonstrates a few tools for interacting directly with the TSDB running in your Healthbot deployment.
The initial overview material in the section below was tailored from this web article.
Time Series Databases
Time Series Databases, as their name state, are database systems specifically designed to handle time-related data.
Most people will be familiar with relational database such as MySQL or Postgres; these systems are based on the fact that they are modelled using tables. These tables contain columns and rows, each one of them defining an entry in your table. Often, those tables are specifically designed for a purpose: one may be designed to store users or maintain Device information. Such systems are efficient, scalable and used by companies worldwide for millions of requests on their servers.
Time series databases work differently. Data is still stored in ‘collections’ but these collections share a common denominator: they are aggregated over time. Essentially, it means that for every point that you can store, you have a timestamp associated with it.
But couldn’t we use a relational database and have a column named ‘time’? Oracle, for example, includes a TIMESTAMP data type that we could use for that purpose. You could, but that would be inefficient.
Time series databases systems are built around the predicate that they need to ingest data in a fast and efficient way.
Indeed, relational databases do have a fast ingestion rate for most of them, from 20k to 100k rows per second. However, ingestion is not constant over time. Relational databases have one key aspect that make them slow when data tends to grow: indexes.
When you add new entries to your relational database, and if your table contains indexes, your database management system will repeatedly re-index your data for it to be accessed in a fast and efficient way. As a consequence, the performance of your DBMS tends to decrease over time. The load is also increasing over time, resulting in having difficulties reading your data.
Time series database are optimized for a fast ingestion rate. It means that such index systems are optimized to index data that is aggregated over time: as a consequence, the ingestion rate does not decrease over time and stays stable, around 50k to 100k lines per second on a single node.
InfluxDB
InfluxDB is an open-source time-series database (TSDB) developed by InfluxData. It is written in Go and optimized for fast, high-availability storage and retrieval of time series data in fields such as operations monitoring, application metrics, Internet of Things sensor data, and real-time analytics.
Before starting, you need to know which version of InfluxDB you are currently using. As of April 2019, InfluxDB comes in two versions; v1.7+ and v2.0. v2.0 is currently in alpha version and puts the Flux language as a centric element of the platform. v1.7 is equipped with InfluxQL language (and Flux if you activate it). As of 2.0.2 Healtbot is based on InfluxDB v1.x
Further information on the query language can be found at Influx Query Language(IFQL).
In the guide below, I shall show some sample IFQL queries, you can run these against your own Healthbot Server using the InfluxDB Client.
Connecting to the InfluxDB instance on your Healthbot server using the influx client can be done using Docker to connect to the influx container on Healthbot and running the influx cli tool, as below:
$ DOCKER_HOST=ssh://root@172.26.138.139 sh -c 'docker exec -it healthbot_influxdb_1 /bin/bash'
$ influx
Connected to http://localhost:8086 version 1.5.2
InfluxDB shell version: 1.5.2
>
InfluxDB Key Concepts
In this section, we will go through the list of essential terms to know to deal with InfluxDB in 2019.
Database
A database is a relatively simple concept to understand on its own because you are used to using this term with relational databases. In a SQL environment, a database would host a collection of tables, and even schemas and would represent one instance on its own.
In InfluxDB, a database hosts a collection of measurements. However, a single InfluxDB instance can host multiple databases. This is a significant differentiation from traditional database systems.
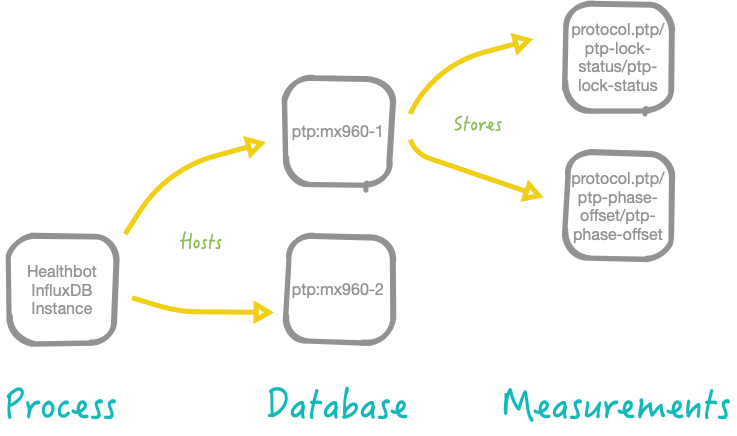
The most common ways to interact with databases are either creating a database or by navigating (use) into a database to see collections (you have to be “in a database” to query collections; otherwise it won’t work). E.g. we can navigate into database-1 as follows:
use ptp:mx960-1;
Healthbot will create lots of InfluxDB Databases. There will be internal databases used by the various Healthbot processes, and there will be databases that represent the telemetry collected from the Device Group:Devices involved in running instances of Playbooks. We will focus this guide on understanding the latter.
Measurement
As shown in the diagram above, a database stores multiple measurements. You should think of a measurement as a SQL table. It stores data, and even metadata, over time. Data that is meant to coexist together should be stored in the same measurement.
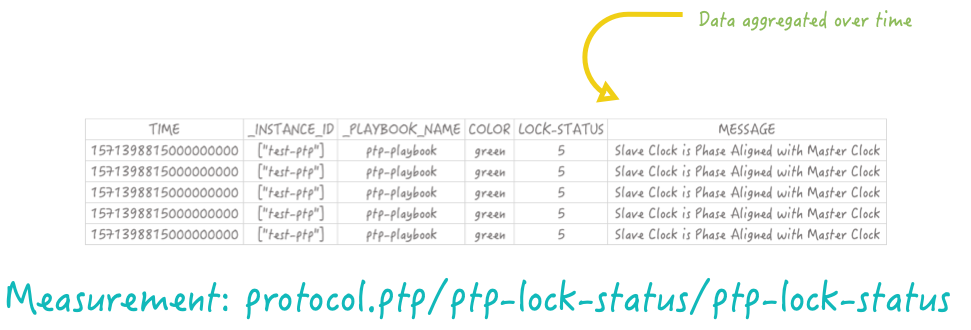
An example IFQL query for this measurement would be:
select * from "protocol.ptp/ptp-lock-status/ptp-lock-status" limit 5;
Note the use of inverted commas around the measurement name as the name includes the forward-slash and dot characters.
In a SQL world, data is stored in columns, but in InfluxDB we have two other terms: tags & fields.
Tags & Fields
This is a significant topic, as it explains the subtle difference between tags & fields.
When defining a new ‘column’ in InfluxDB, you have the choice to either declare it as a tag or as a field, and it makes a huge difference.
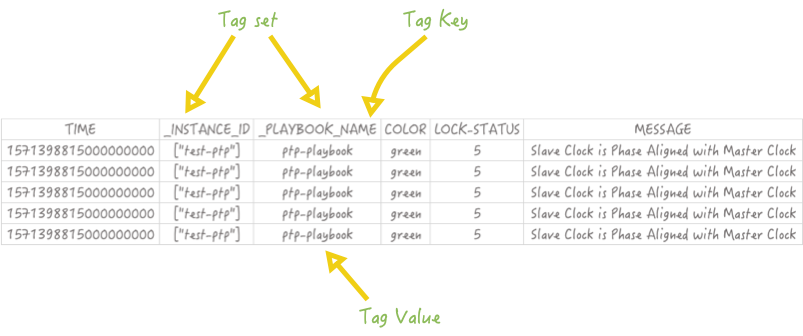
The most significant difference between the two is that tags are indexed and fields are not. Tags can be seen as metadata defining our data in the measurement. They are hints giving additional information about data, but not data itself.
Fields, on the other hand, is data. In our last example, the temperature ‘column’ would be a field.
Back to our protocol.ptp/ptp-lock-status/ptp-lock-status example, let’s say that we wanted to add a column named ‘location’ as its name states, defines where the sensor is.
Should we add it as a tag or a field?

In this case, it would be added as a tag! We want the location ‘column’ to be indexed and taken into account when performing a query over the location.
Now that we’ve added the location tag to our measurement let’s go a bit deeper into the taxonomy.
A set of tags is called a “tag-set”. The ‘column name’ of a tag is called a “tag key”. Values of a tag are called “tag values”. The same taxonomy repeats for fields.
Timestamp
Probably the most straightforward keyword to define. A timestamp in InfluxDB is a date and a time defined in RFC3339 format. When using InfluxDB, it is ubiquitous to define your time column as a timestamp in Unix time expressed in nanoseconds.
Retention policy
A retention policy defines how long you are going to keep your data. Retention policies are defined per-database and, of course, you can have multiple of them. By default, the retention policy is ‘autogen‘ and will basically keep your data forever. In general, databases have multiple retention policies that are used for different purposes.
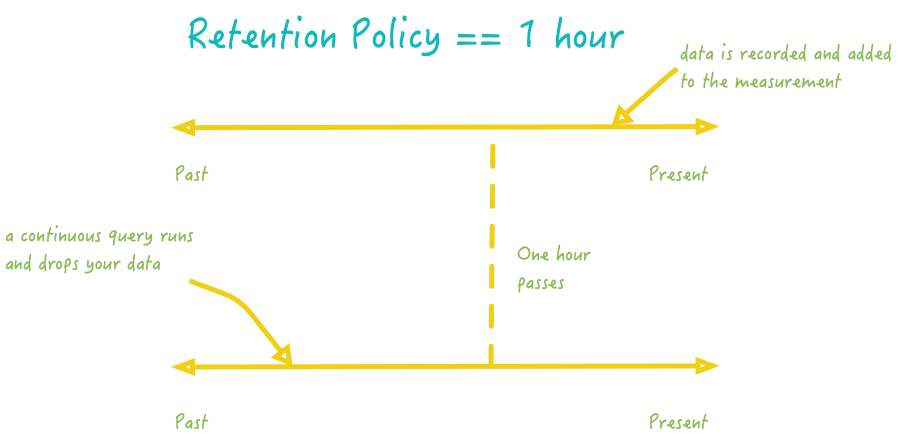
What is a typical use-case of retention policies?
If you are using InfluxDB for live monitoring of an entire infrastructure, you want to be able to detect when a server goes off, for example. In this case, you are interested in data coming from that server currently. You are not interested in keeping the data for several months, as a consequence you want to define a small retention policy: one or two hours.
Point
Finally, an easy one to end this chapter about InfluxDB terms. A point is simply a set of fields that has the same timestamp. In a SQL world, it would be seen as a row or as a unique entry in a table.
Chronograf
Chronograf allows you to quickly see the data that you have stored in InfluxDB so you can build robust queries and alerts. It is simple to use and includes templates and libraries to allow you to rapidly build dashboards with real-time visualizations of your data.
We can use a docker image to run a local instance of Chronograf and point it towards the influxdb instance running in Healthbot.
docker run -p 8888:8888 chronograf --influxdb-url=http://hb-server:8086
After starting the image, the docker container exposes the Chronograf web interface at http://[::]:8888/sources/0/chronograf/data-explorer on your local machine. Opening this web page, you'll see a view similar to below.
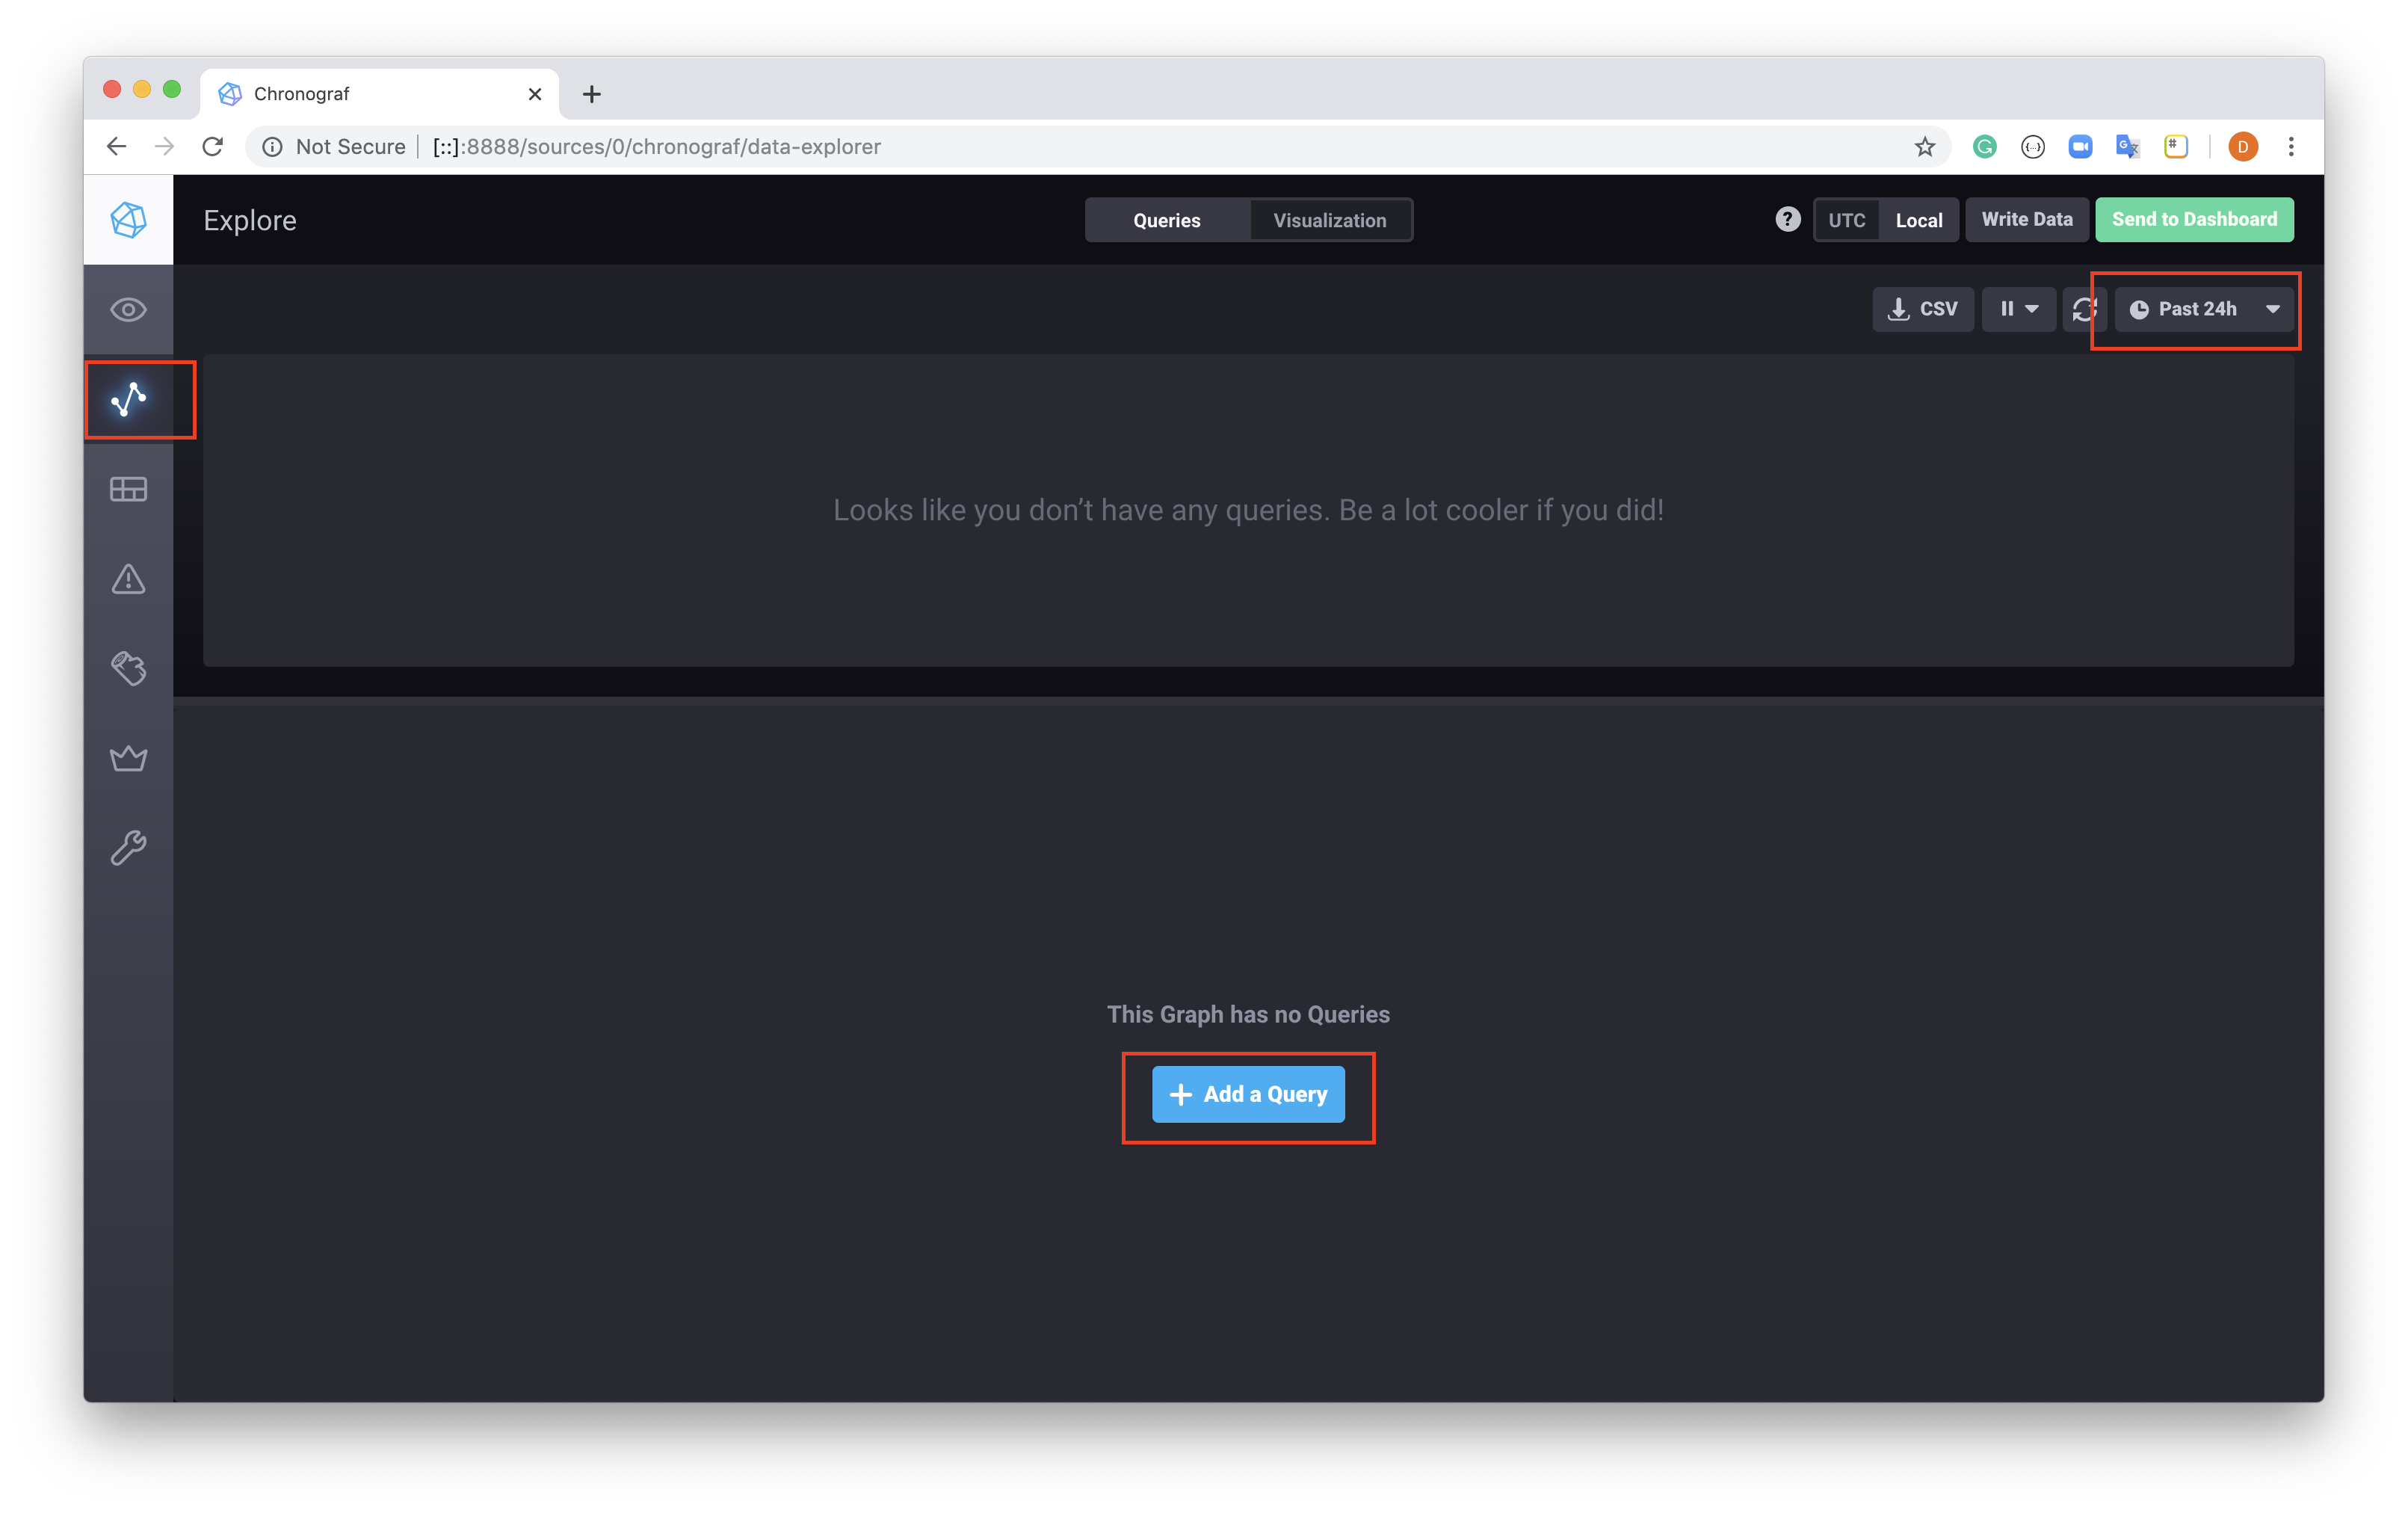
On the top left, select the Explore sidebar menu option, this will open a view where the metrics from the Past 24hrs are available, at this point select Add a Query.
The tool provides a query builder that we demonstrate below.
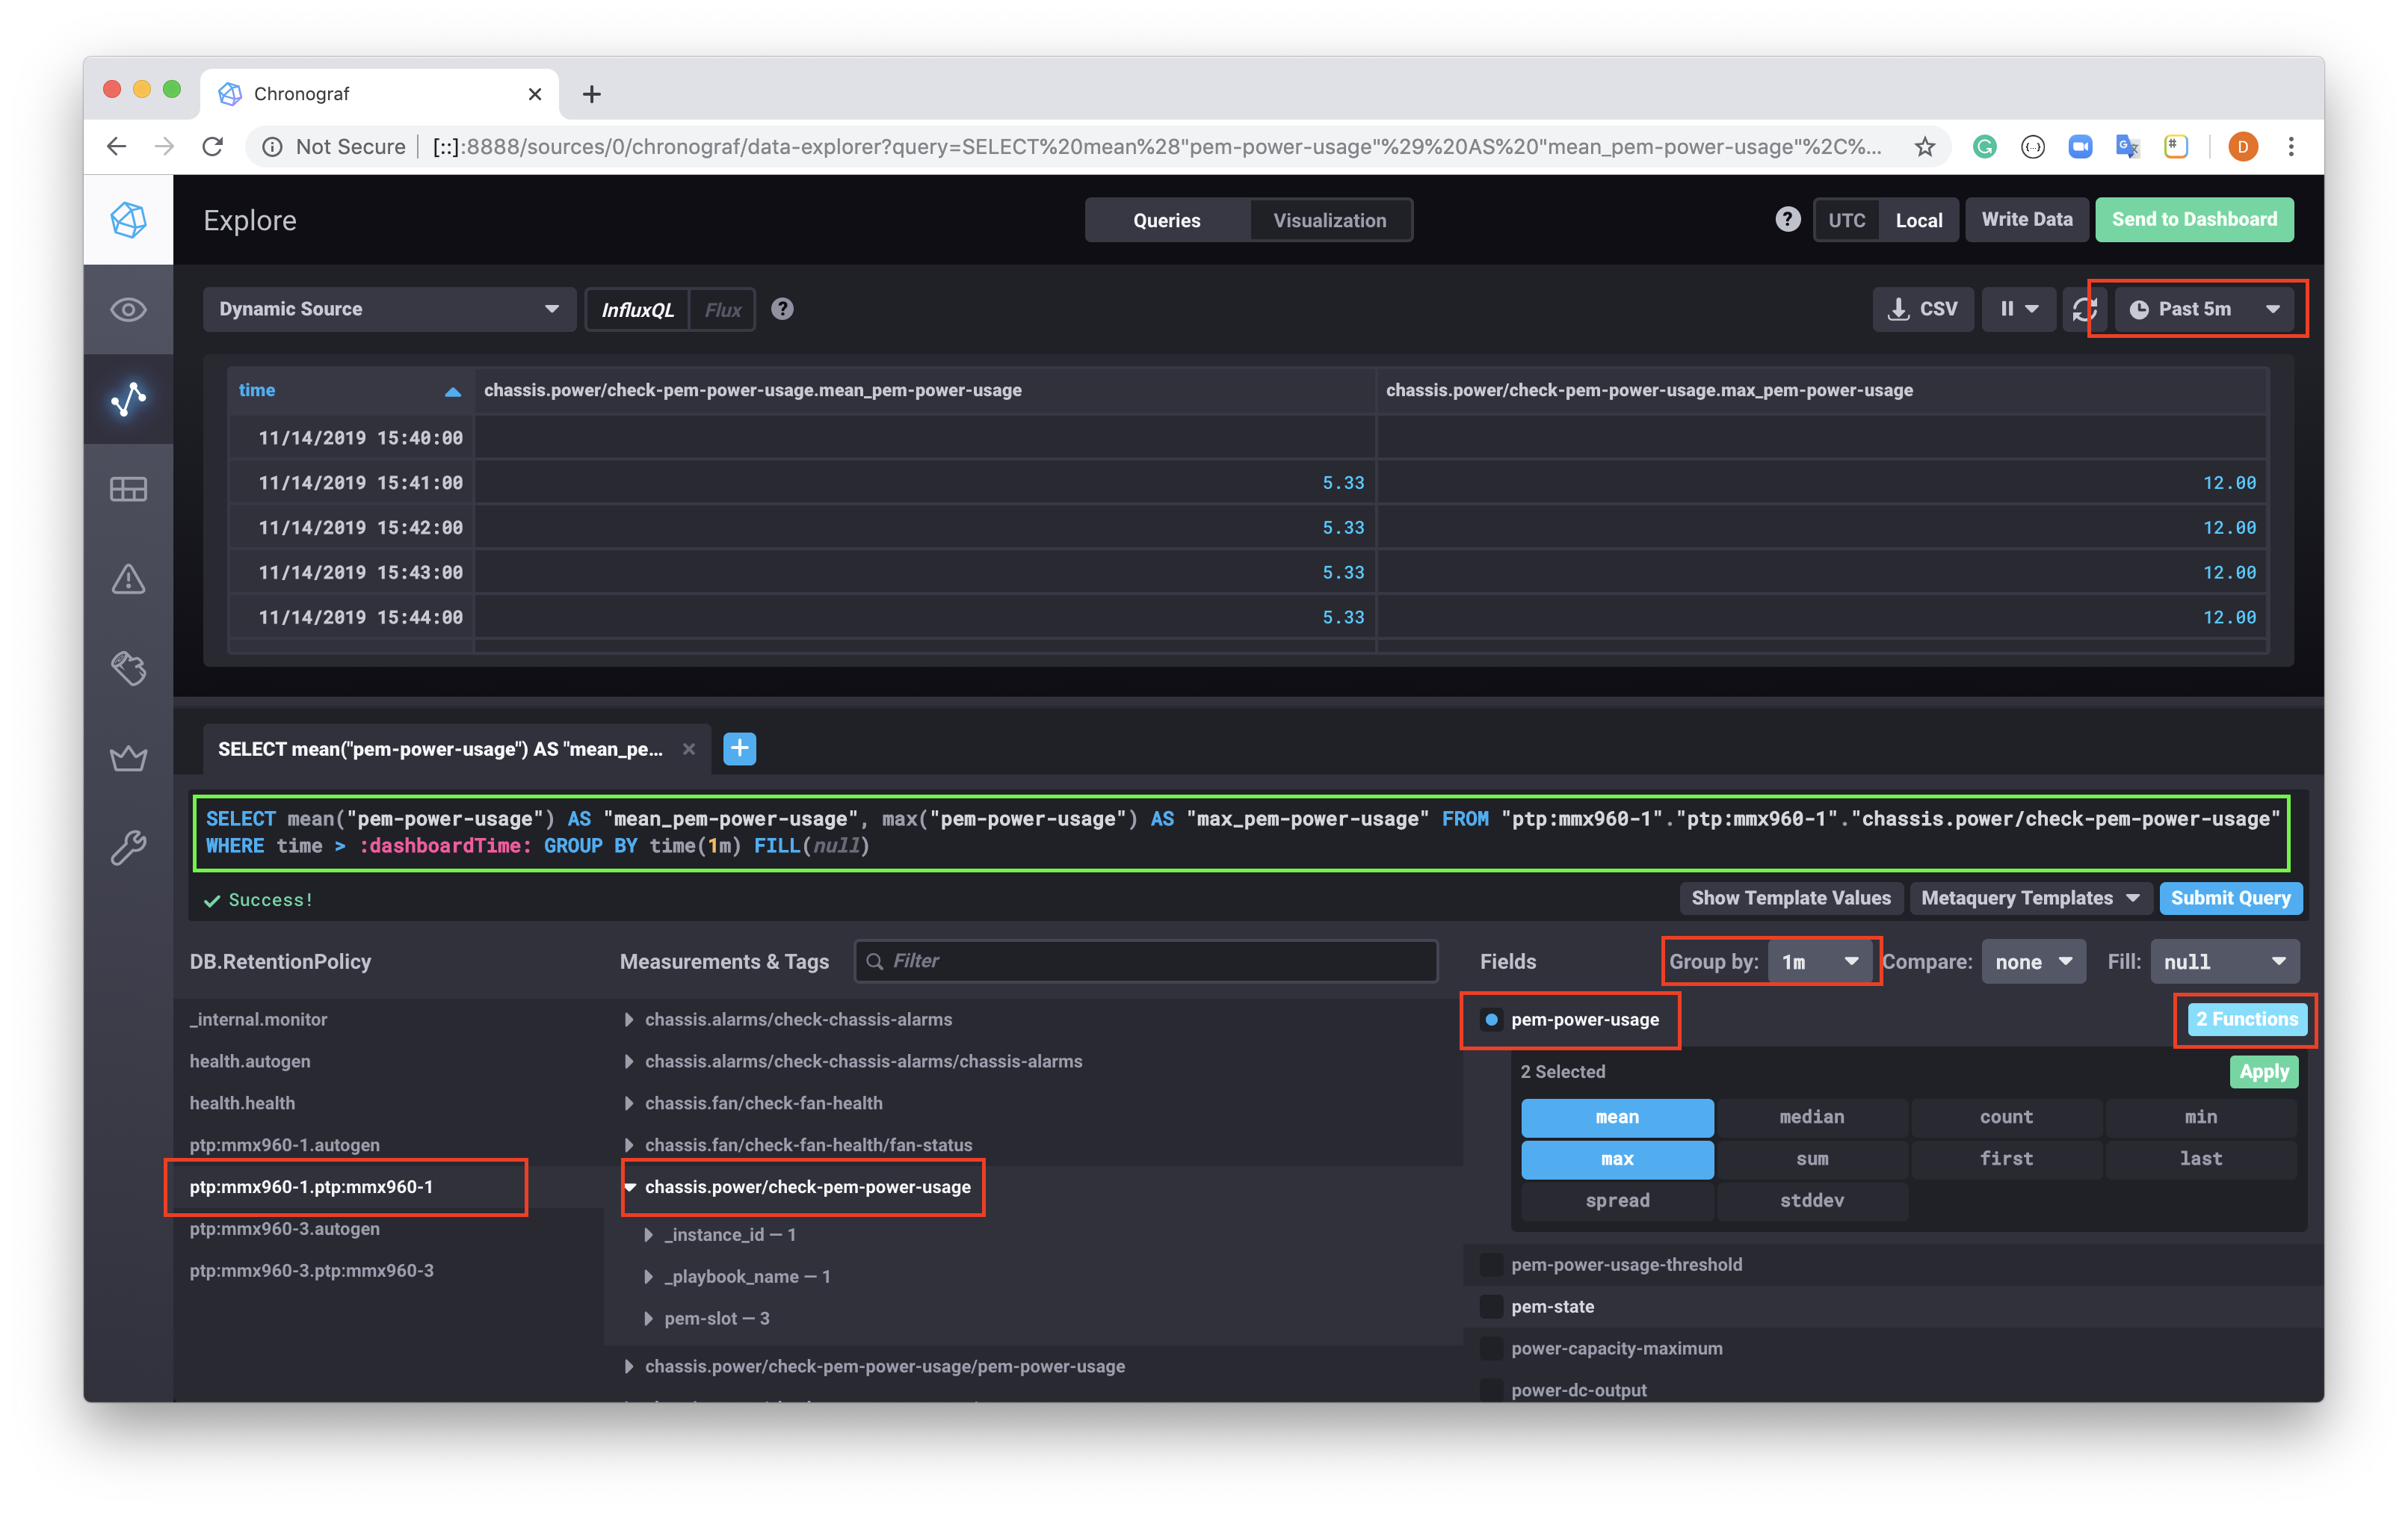
You can see that a query can be constructed by selecting the DB, then the Measurements and Tags, then Fields that you're interested in. In our case;
| DB | Measurements & Tags | Fields |
|---|---|---|
| ptp:mx960-1.ptp:mx960-1 | chassis.power/check-pem-power-usage | pem-power-usage |
Once selected, we can choose from one or more of the inbuilt functions to graph against the values, in the example above the mean and max has been selected. Also note, that the Groupby 1 minute has been selected to aggregate on the 60s retrieval of the data.
The final query generated looks like:
SELECT mean("pem-power-usage") AS "mean_pem-power-usage", max("pem-power-usage") AS "max_pem-power-usage" FROM "ptp:mx960-1"."ptp:mx960-1"."chassis.power/check-pem-power-usage" WHERE time > :dashboardTime: GROUP BY time(1m) FILL(null)
Resulting in the table above showing values over a 5min window.
At this point we can use the query to create a Dashboard, selecting the Send to Dashboard button at the top right of the screen will result in the popup window below.
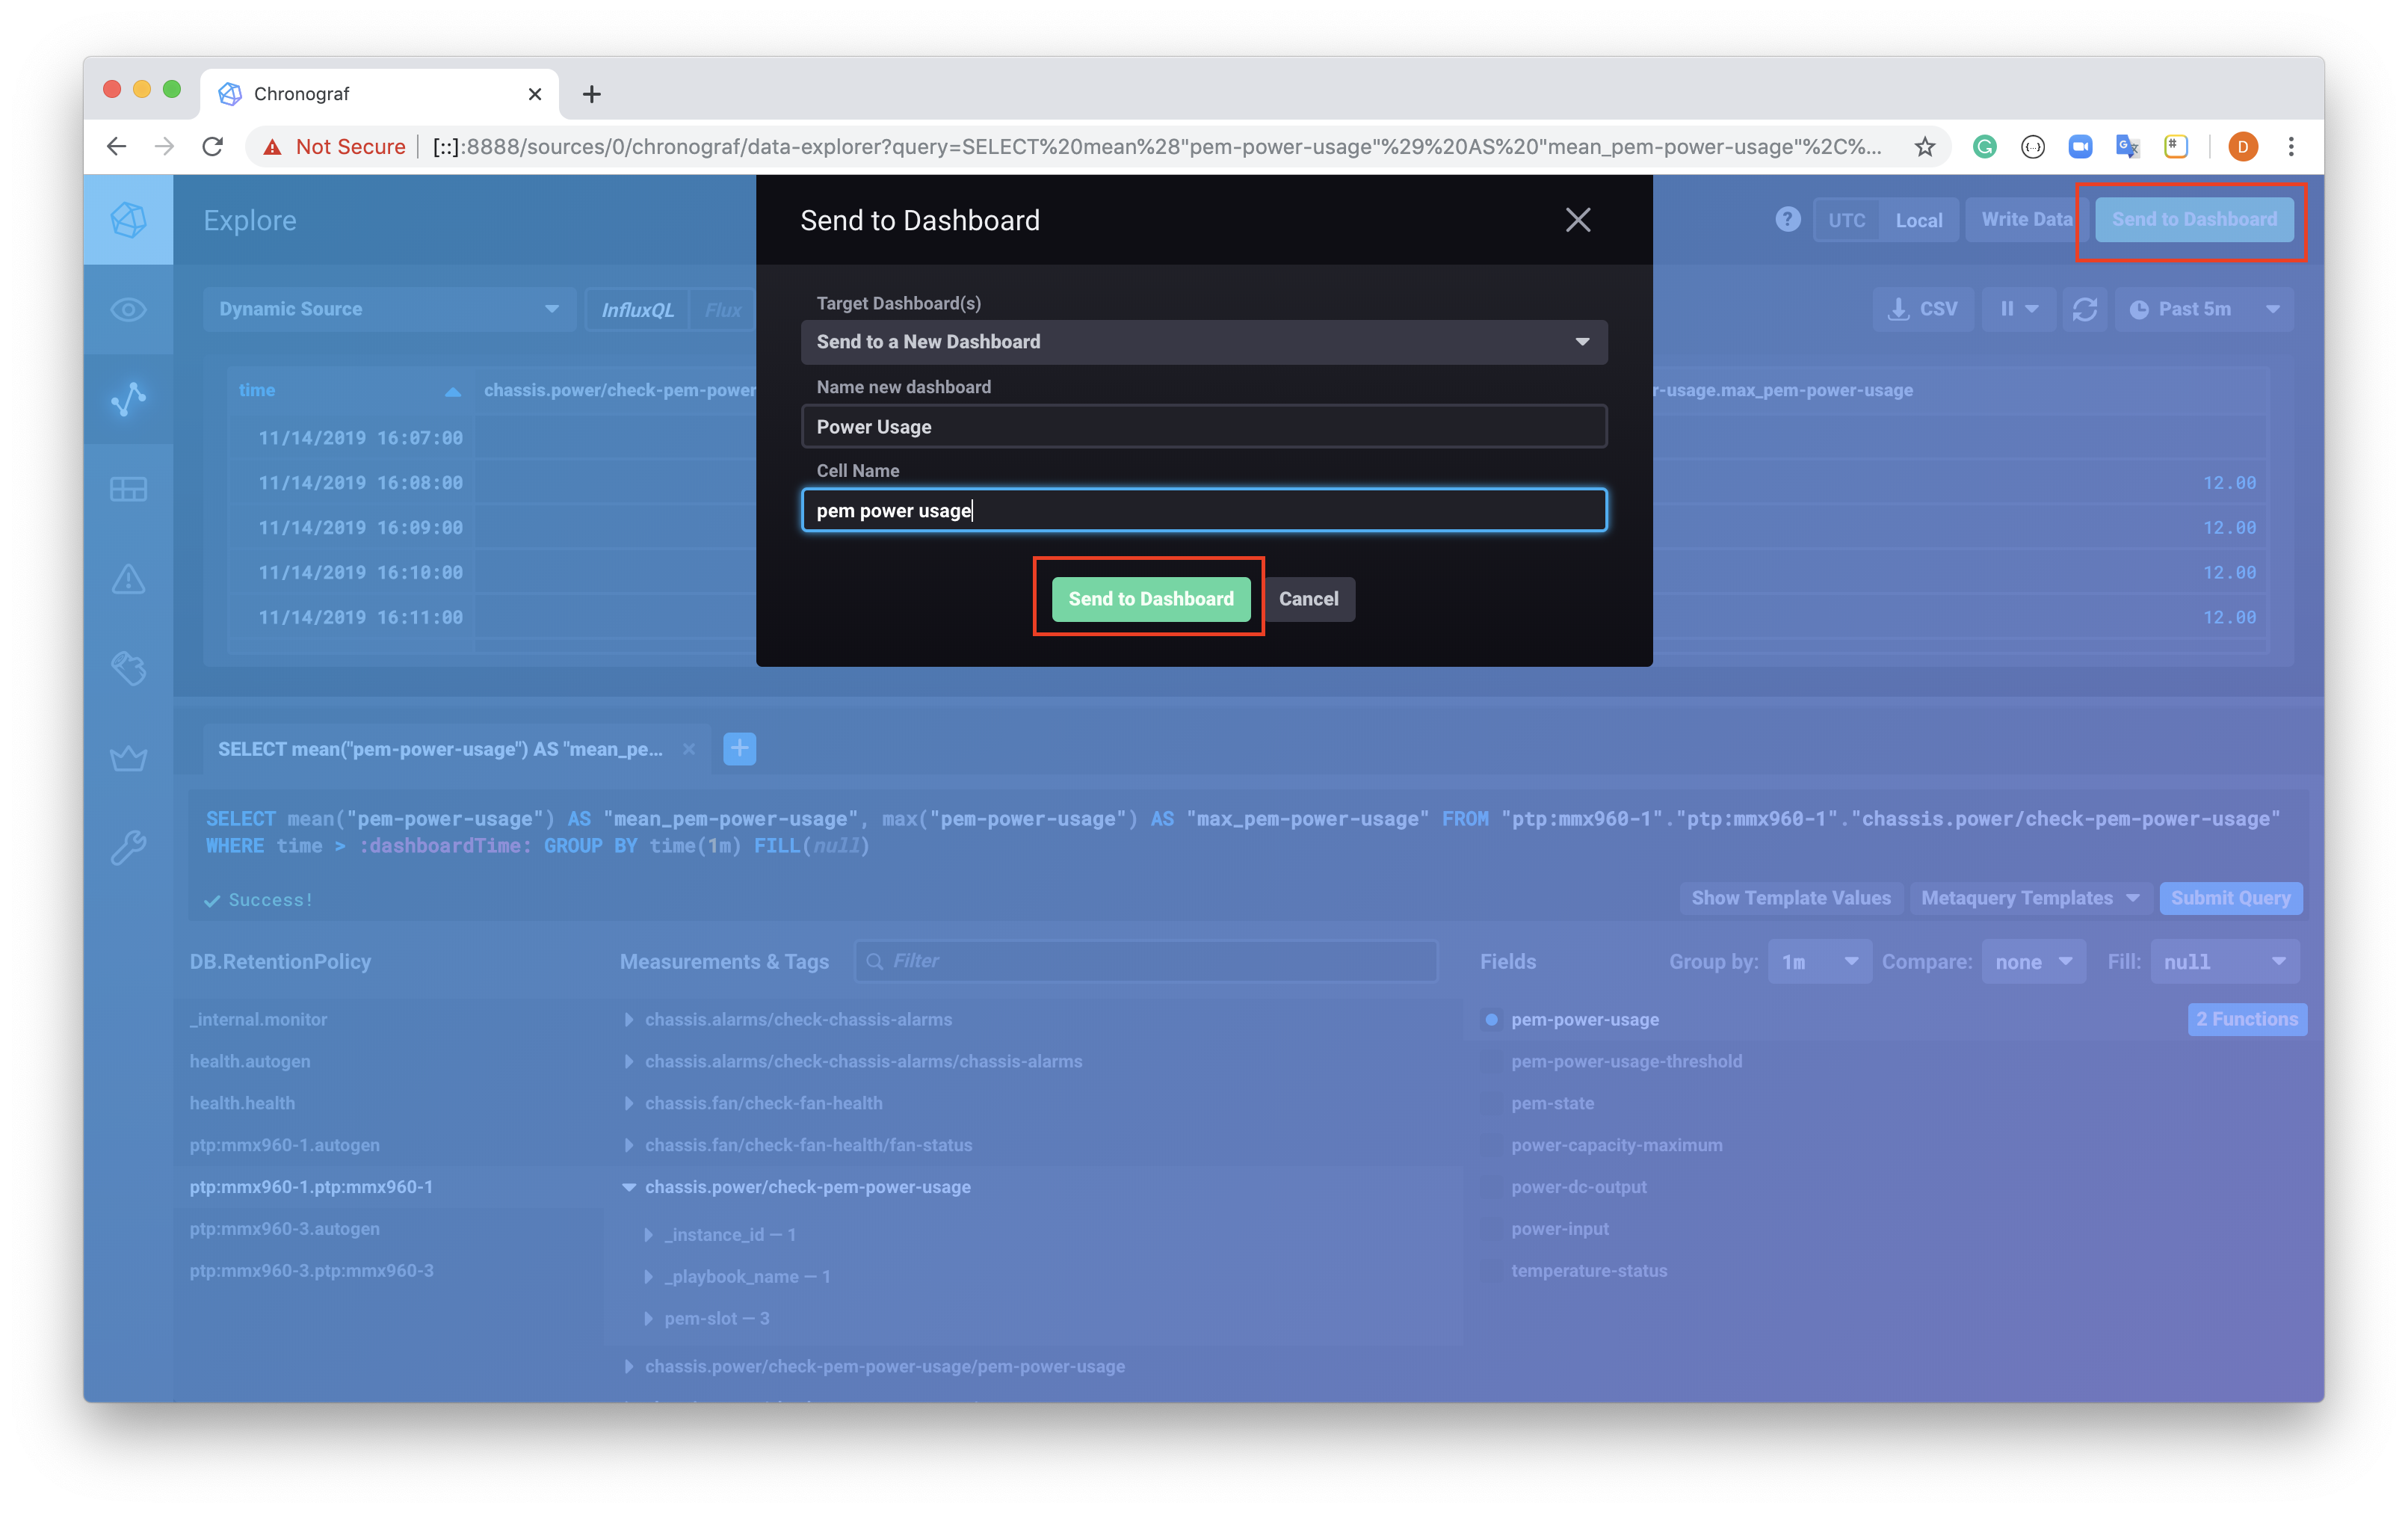
Create and name a new Dashboard, and cell select the Send to Dashboard button highlighted on the popup window.
Now select the Dashboard button from the left sidebar menu.
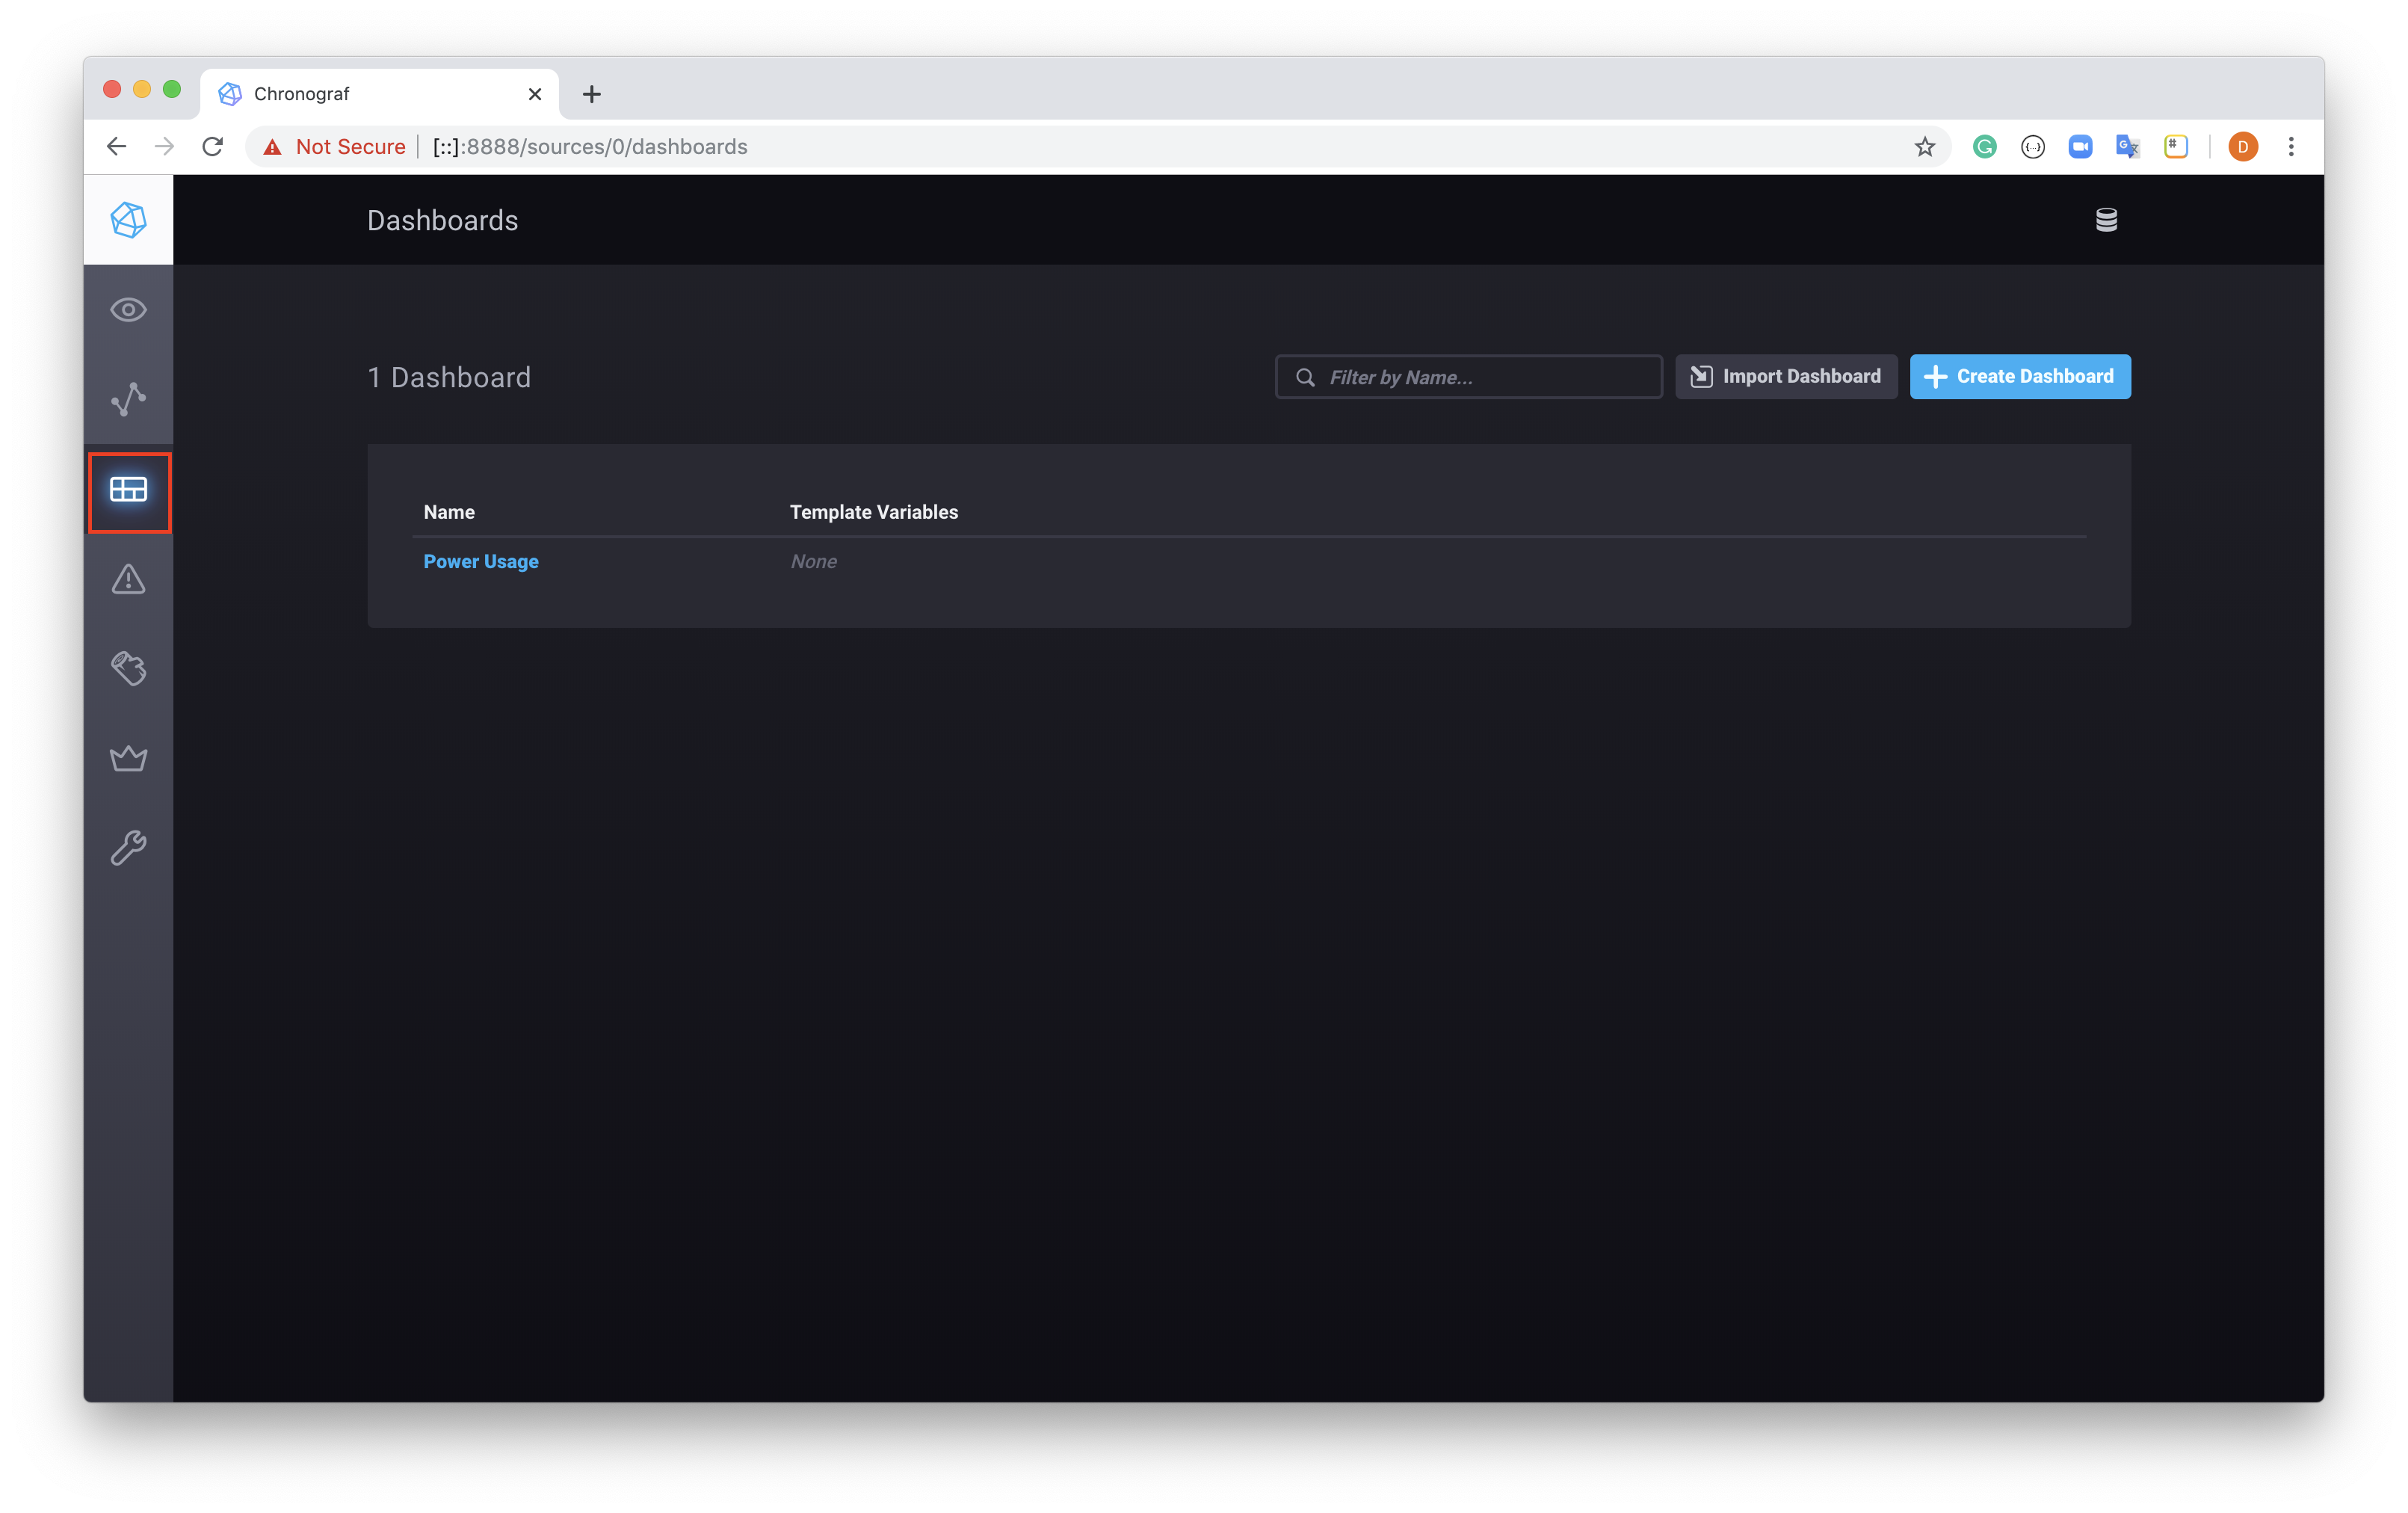
And select the Dashboard you created, in our case Power Usage. You should see something similar to below.
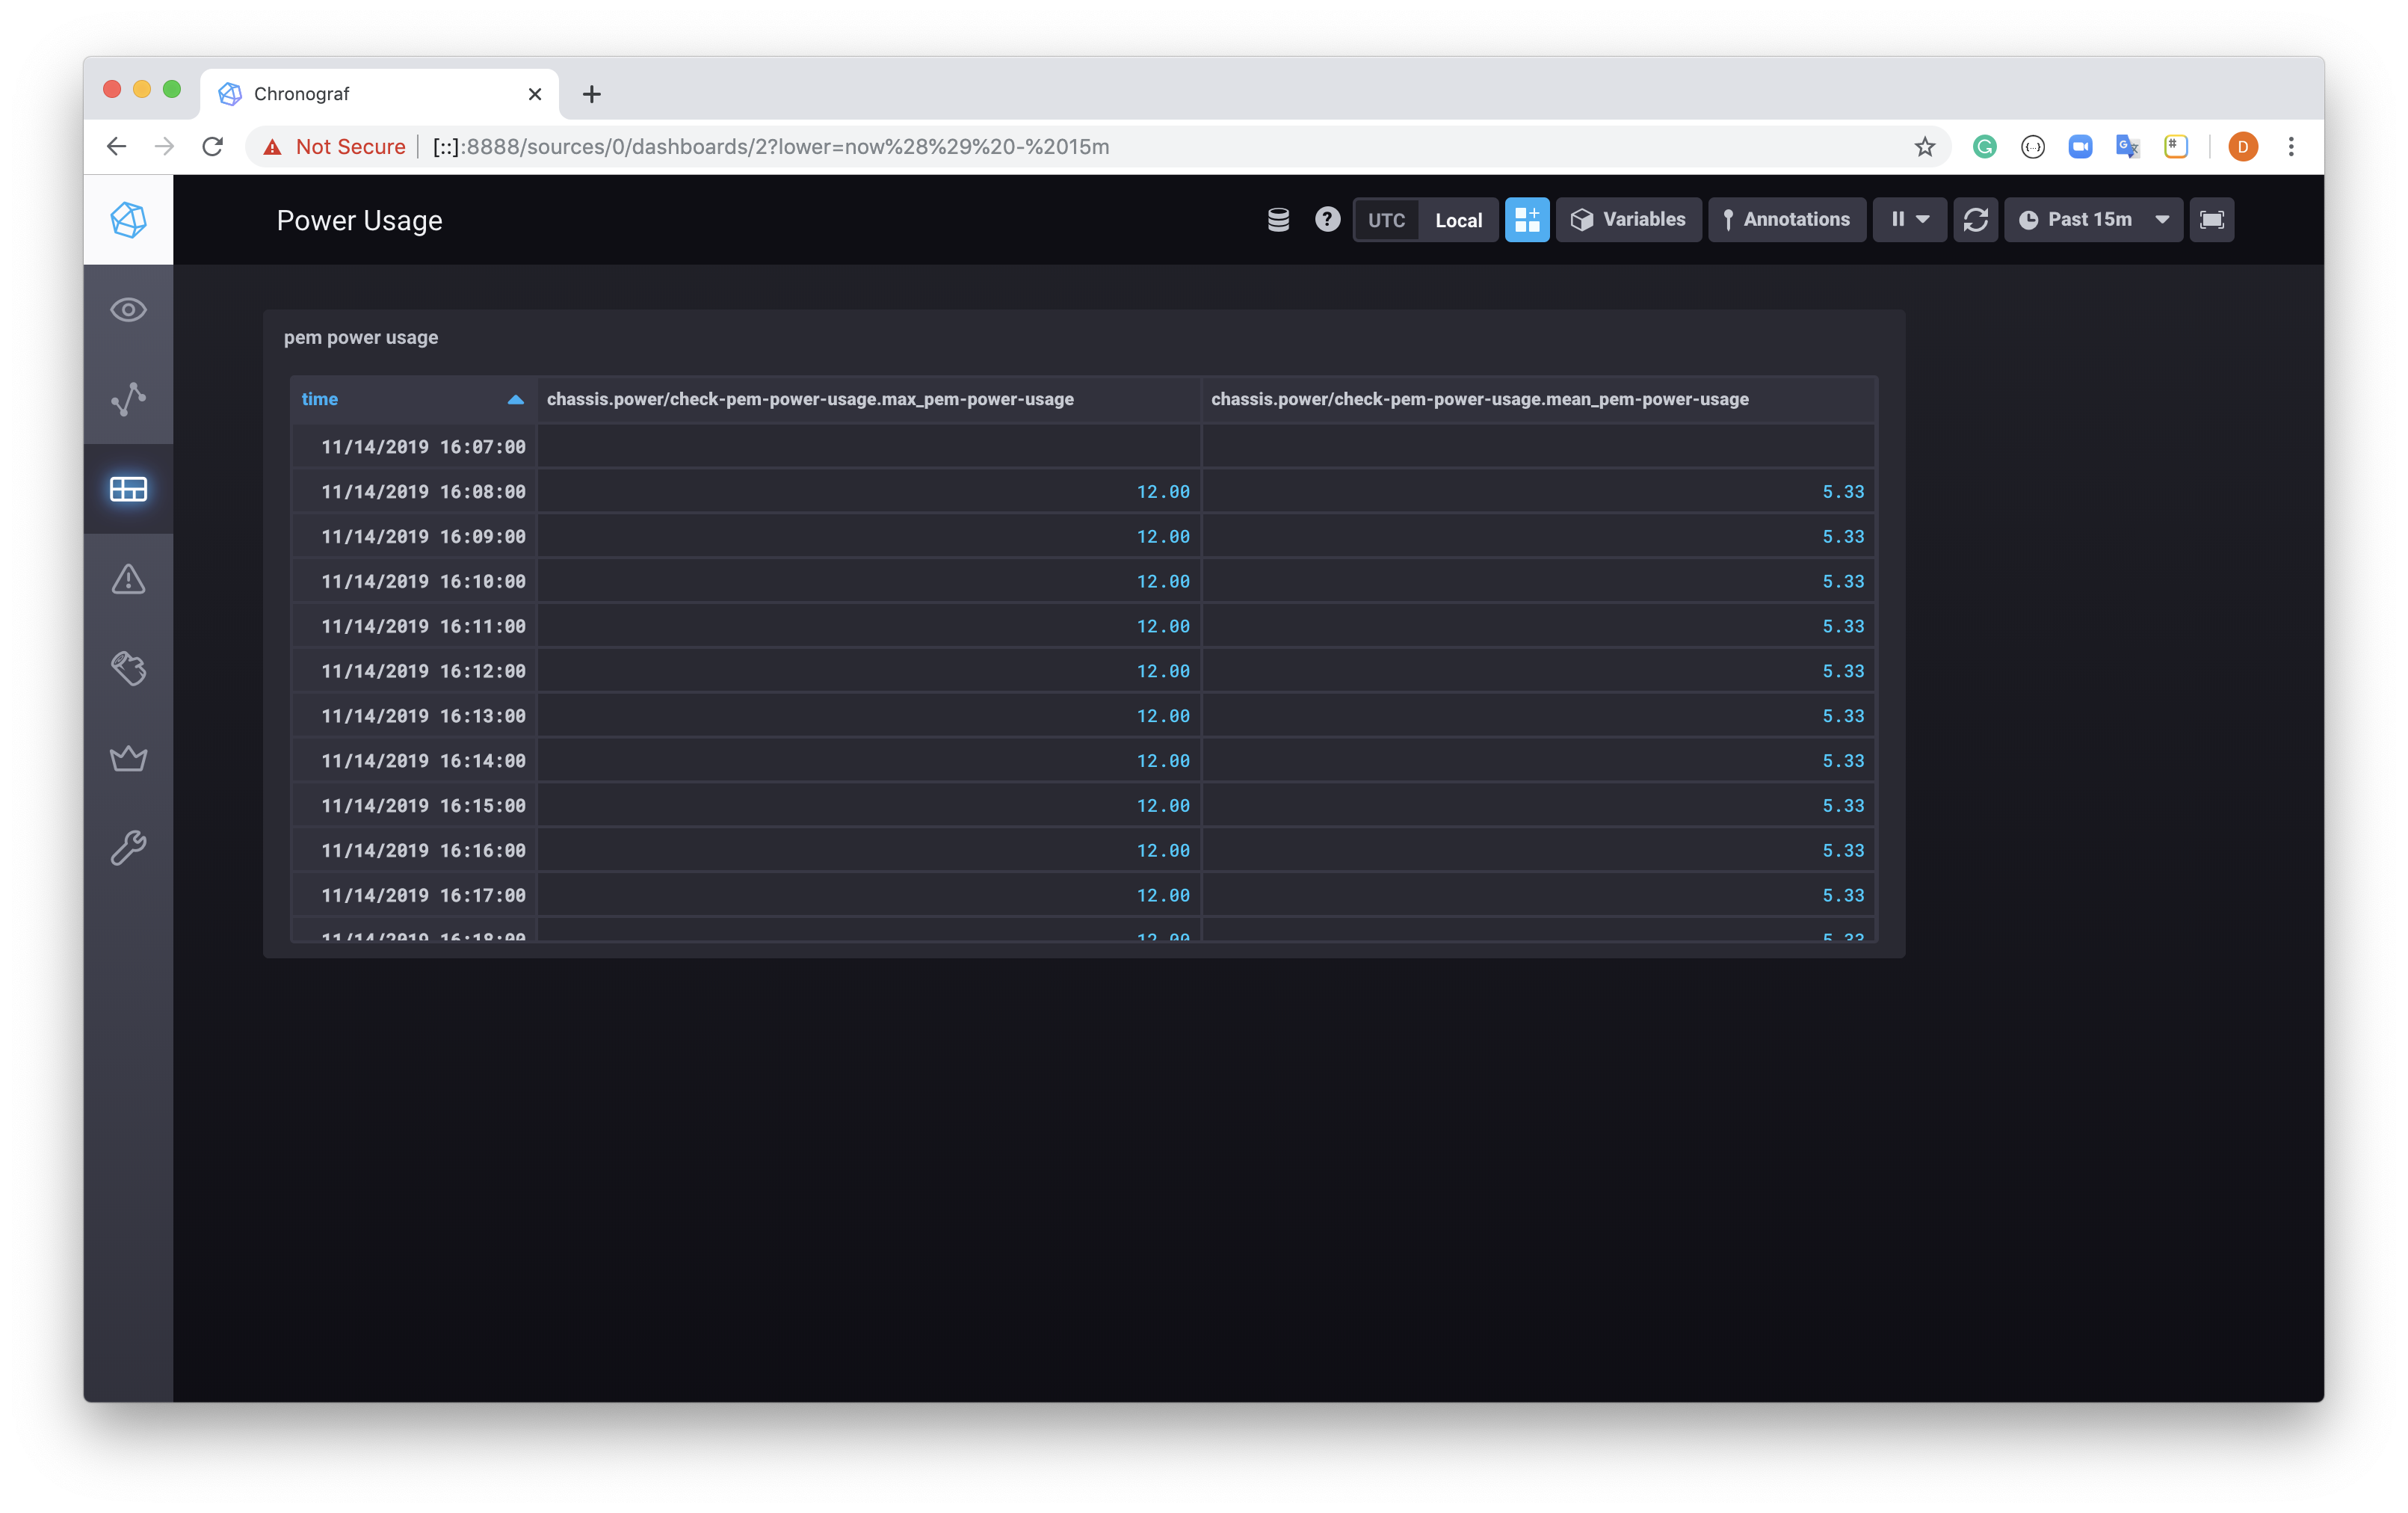
Since this is running in a docker container, the Dashboard will be lost if the container is destroyed, either mount the container with a local volume or look at a non-docker instance of Chronograf if you wish to persist the dashboards you create.
Further information on Chronograf is available from the docs site.