Quickstart
This guide assumes you have installed Healthbot and can access the Dashboard as below.
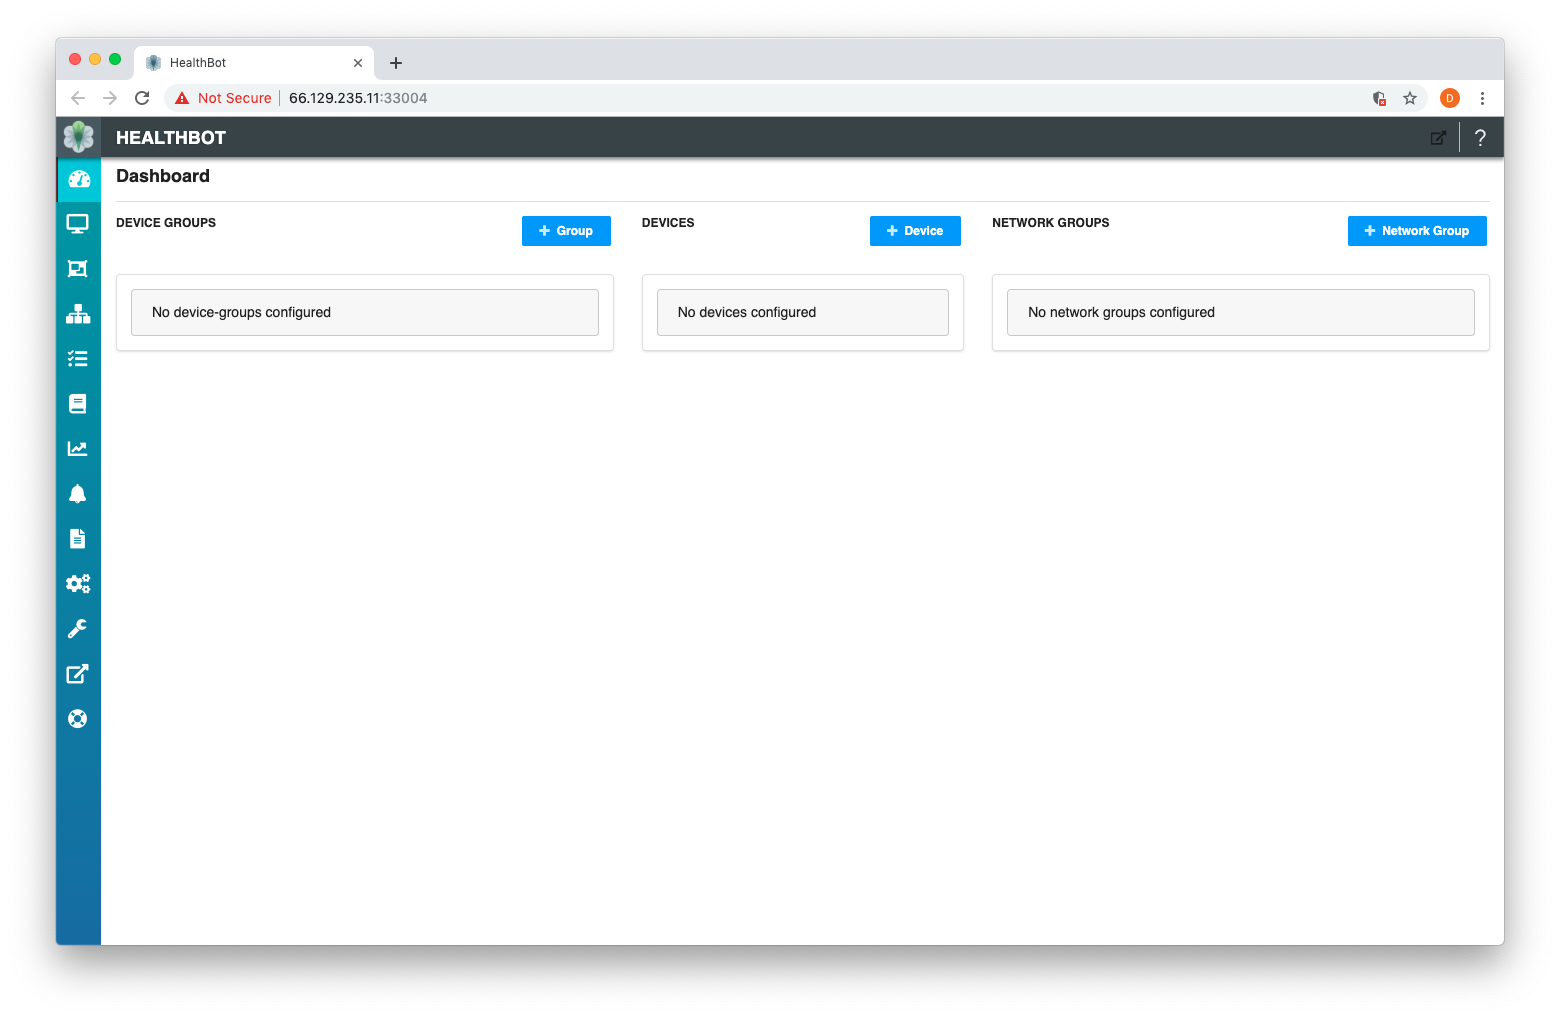
This guide will walk you through the minimum steps required to get Healthbot monitoring one of your Devices.
The process required to do this is as follows:

As shown in the diagram, there are several steps required to go from a blank system to a monitoring Devices.
- Provisioning the Device
- Registering the Device within Healthbot
- Grouping Devices based on a business classifier
- Instantiating a Playbooks against Device Groups
- Monitoring the KPIs within your network
Each of these steps are defined below;
Provision
The initial task is to configure your Device to generate Telemetry towards Healthbot. There are several ways that Healthbot can receive Telemetry (OpenConfig, JTI Native Sensor, NETCONF or SNMP) this guide will focus on OpenConfig.
This document describes the process for enabling OpenConfig on a JUNOS Device.
Implementing OpenConfig with gRPC for JUNOS Telemetry Interface requires that you download and install a package called Network Agent if your Juniper Networks device is running a version of JUNOS OS with Upgraded FreeBSD. For all other versions of JUNOS OS, the Network Agent functionality is embedded in the software. Versions of JUNOS prior to 18.3R1 may require the OpenConfig and Network Agent packages installed.
After logging into the CLI, the Device must be configured for gRPC as follows:
[edit system services]
user@host# set extension-service request-response grpc clear-text
Additional information can be found in the configuring gRPC topic.
Register
Once a Device is provisioned for Telemetry, we can incorporate that Device by configuring its management ip and authentication details within Healthbot.
To register a Device within Healthbot, navigate to the Dashboard page and select + Device button.

This will open a pop-up window as below. At this point you need to provide the following information about your Device:
Device Name: R1
Device Ip Address: 100.123.1.0
Username: jcluser
Password: *****
Assuming your Device is a JUNOS Device, the remaining information can be left as default.
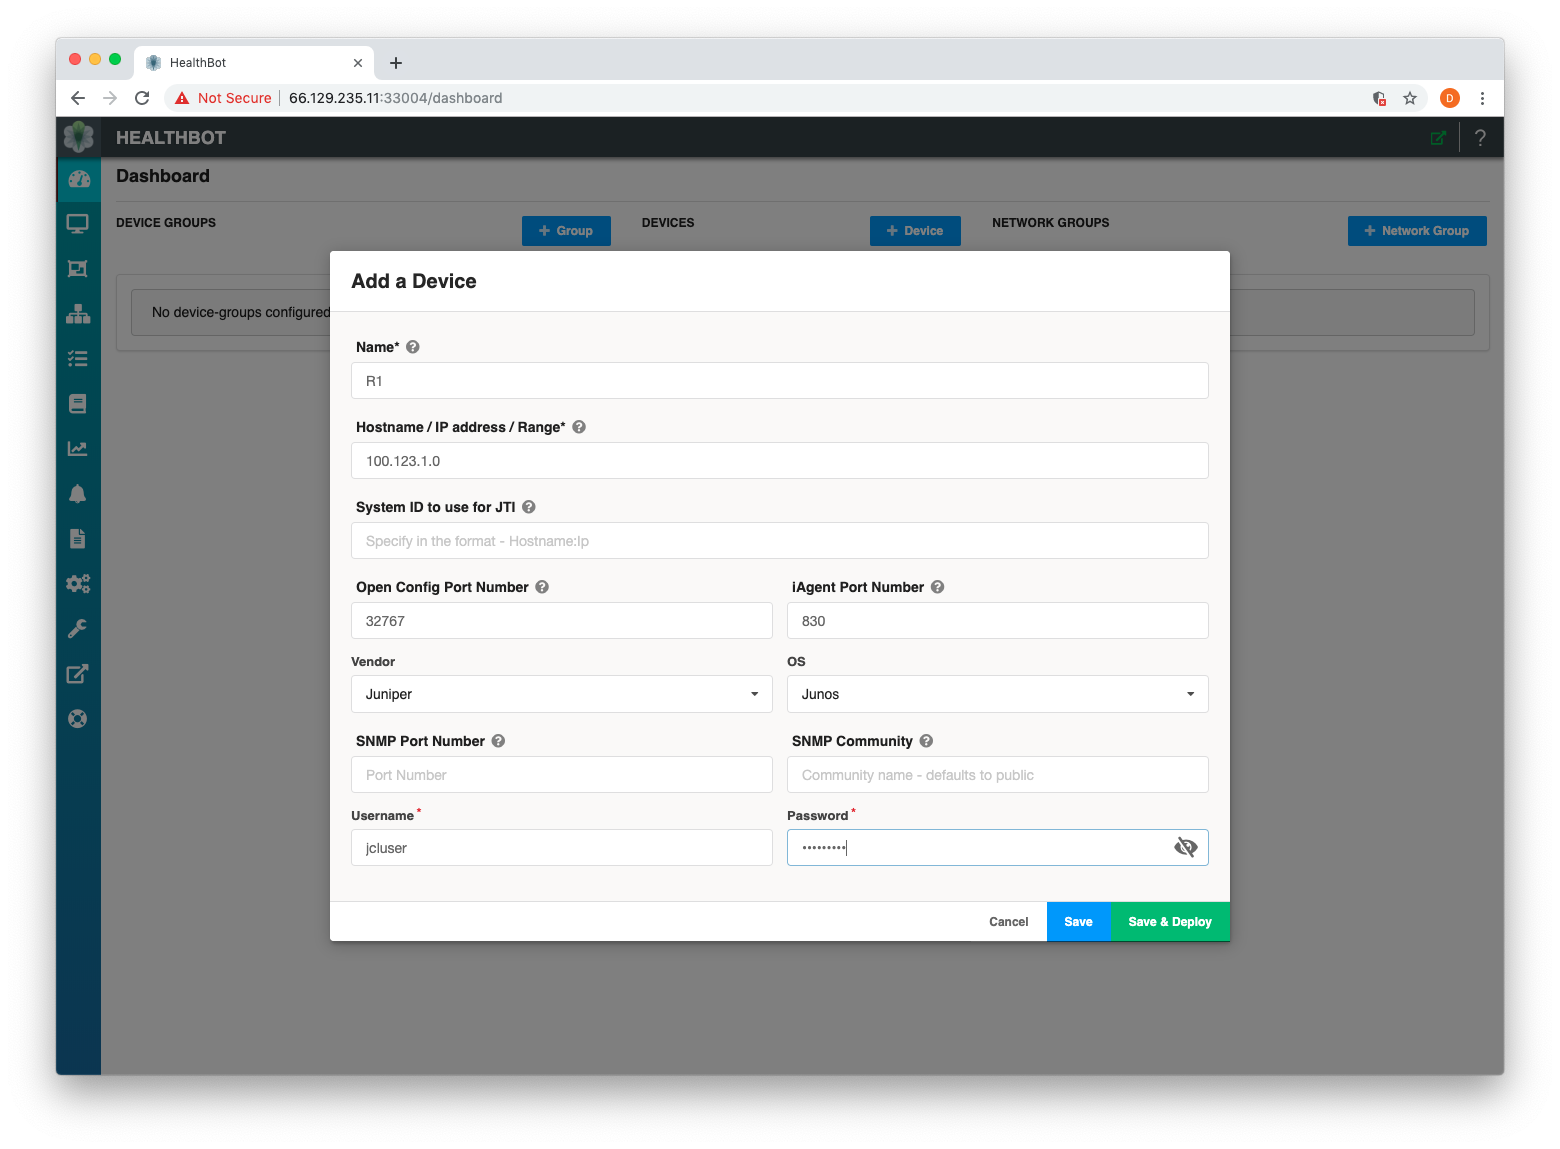
At this point go ahead and select Save and Deploy. Assuming everything worked ok you should now see a screen as follows:
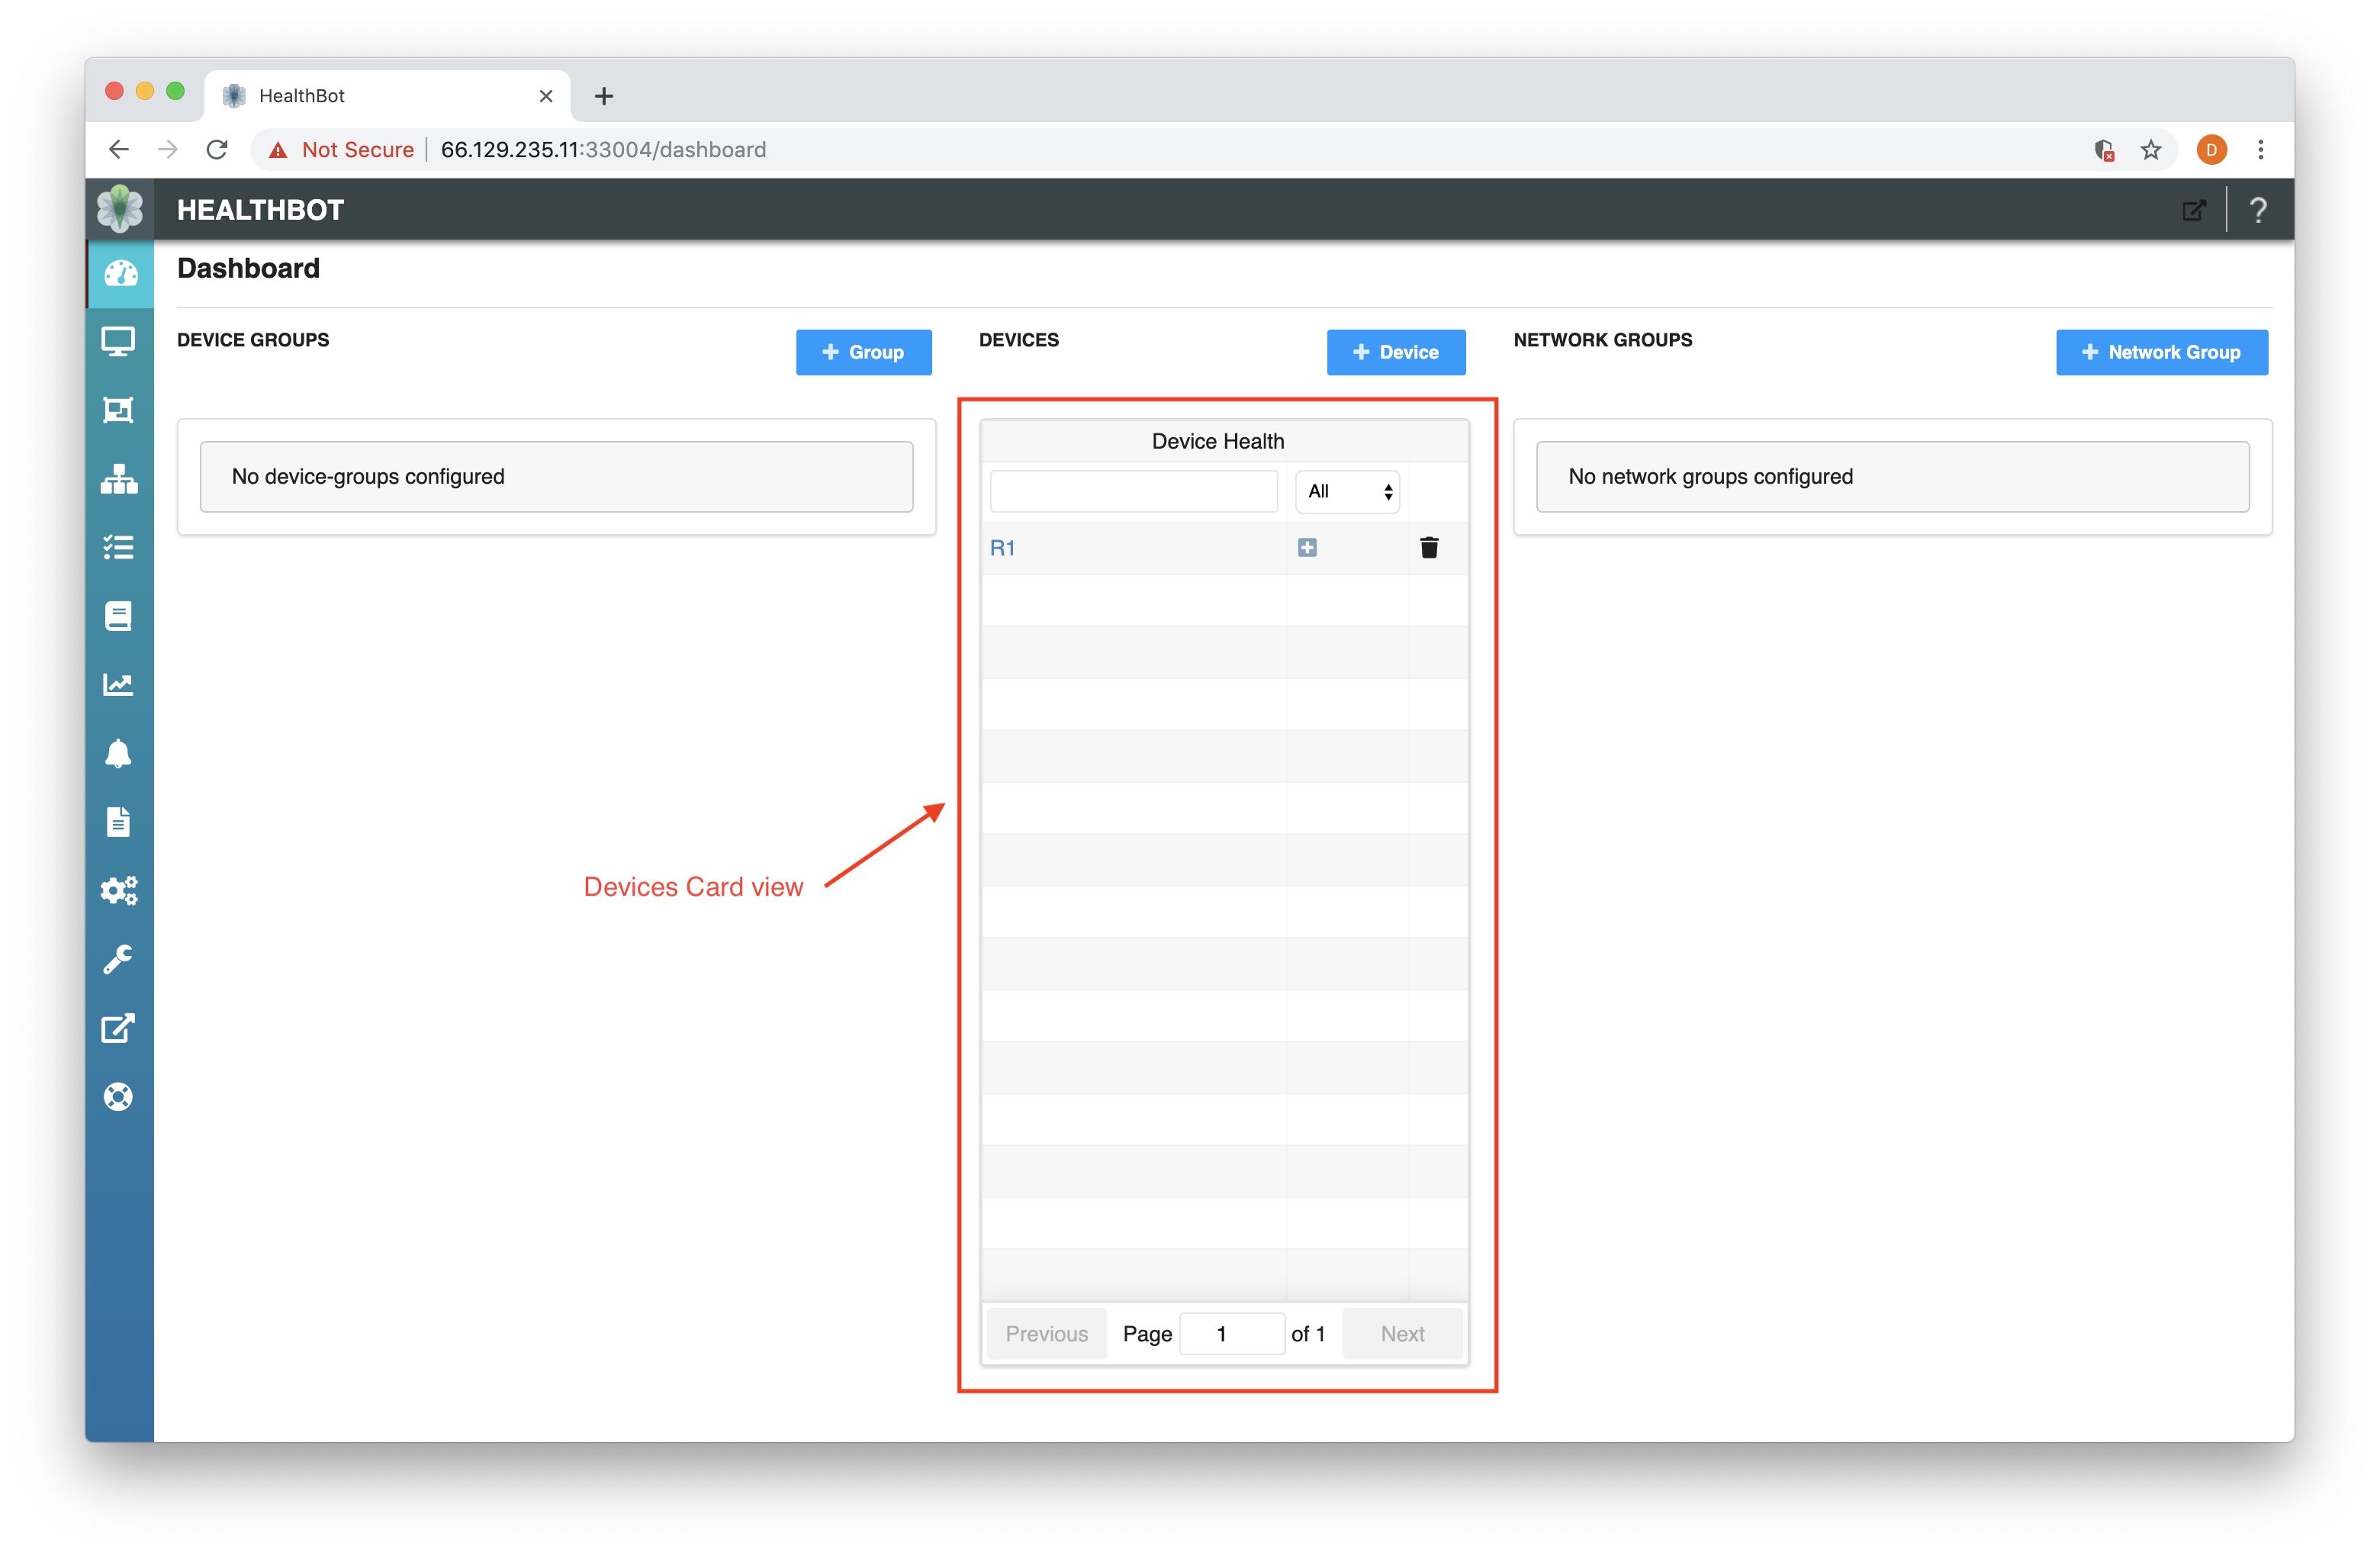
Note in the Devices Card View you can see a single entry for the Device you registered, in my case Device R1.
You should repeat this process for any additional Devices you want to monitor.
Group
When one or more Devices are available within Healthbot we can group them using a classifier that is relevant to our network. E.g. we could define groups for Customer Equipment or Provider Equipment, or we could group on Region, Ownership or any other criteria relevant to our organization.
Why do we want to group Devices? Within Healthbot, Playbooks(discussed later) are instantiated against Device Groups (or Network Groups).
To classify one or more Devices within Healthbot, navigate to the Dashboard page and select + Group button.

This will open a pop-up window as below. At this point you need to provide the following information about your Device Group:
Device Group Name: Customer-Equipment
Devices: R1
Assuming your Device is a JUNOS Device, the remaining information can be left as default.
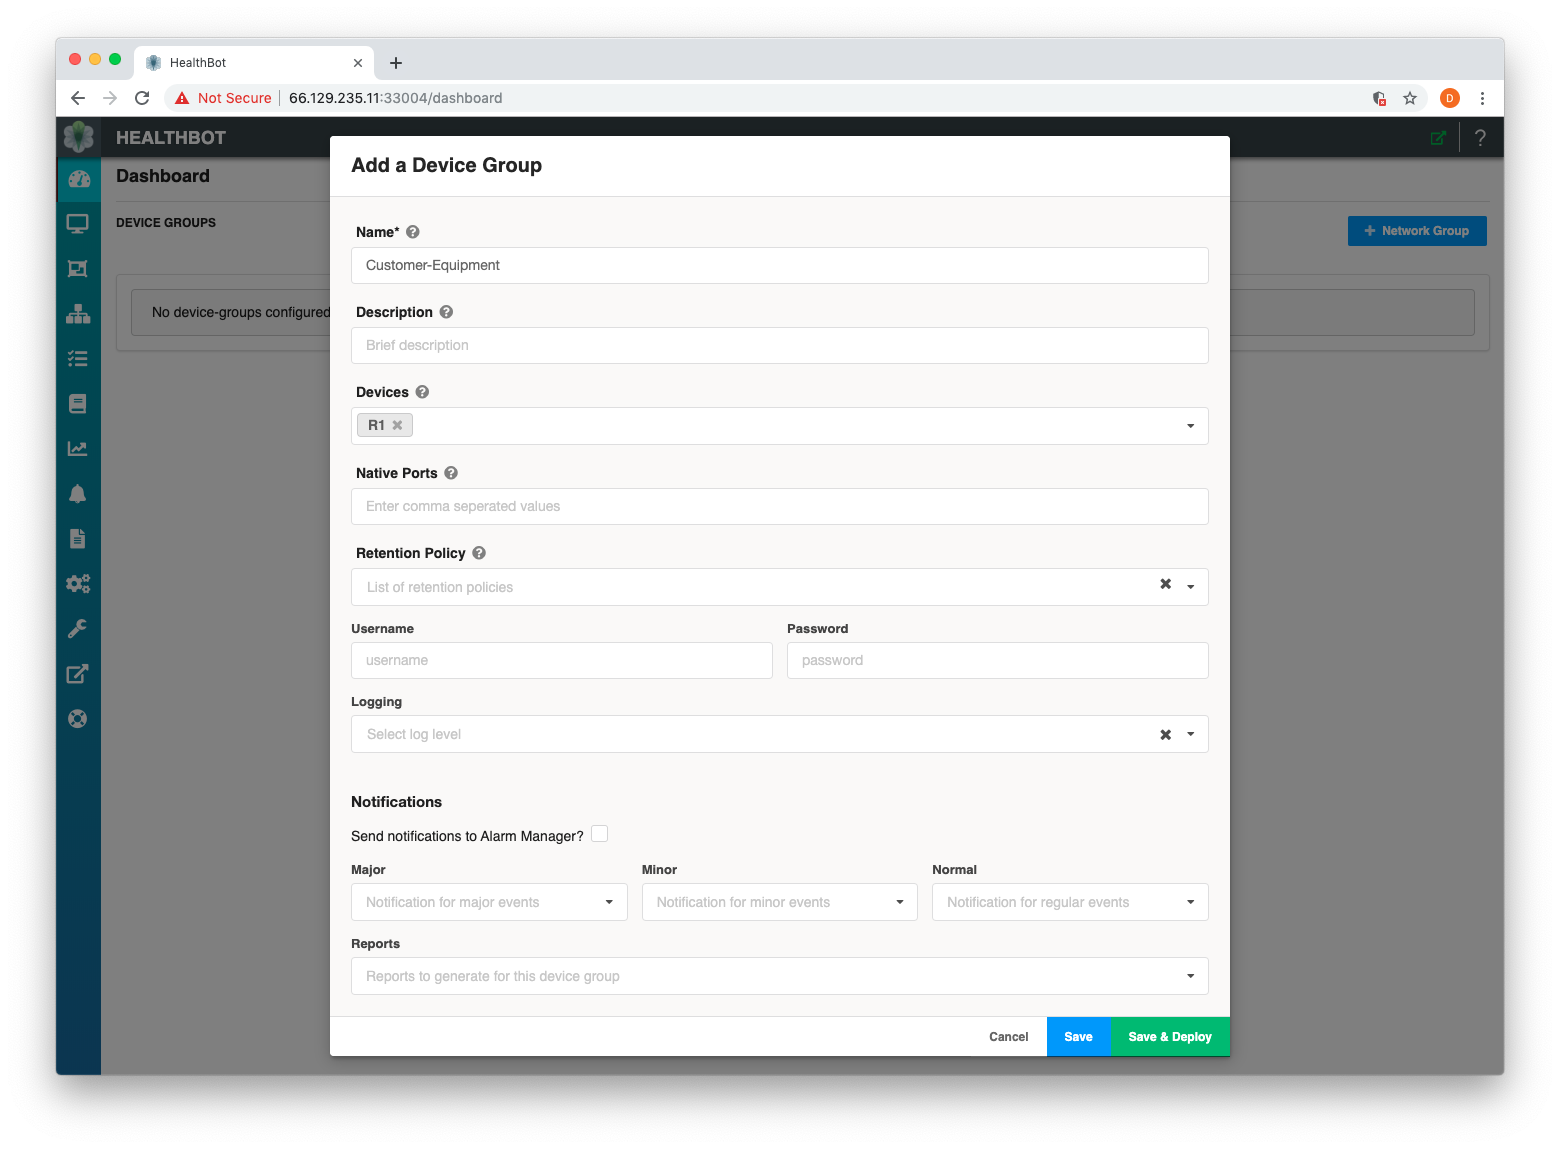
At this point go ahead and select Save and Deploy. Assuming everything worked ok, you should now see a screen as follows:
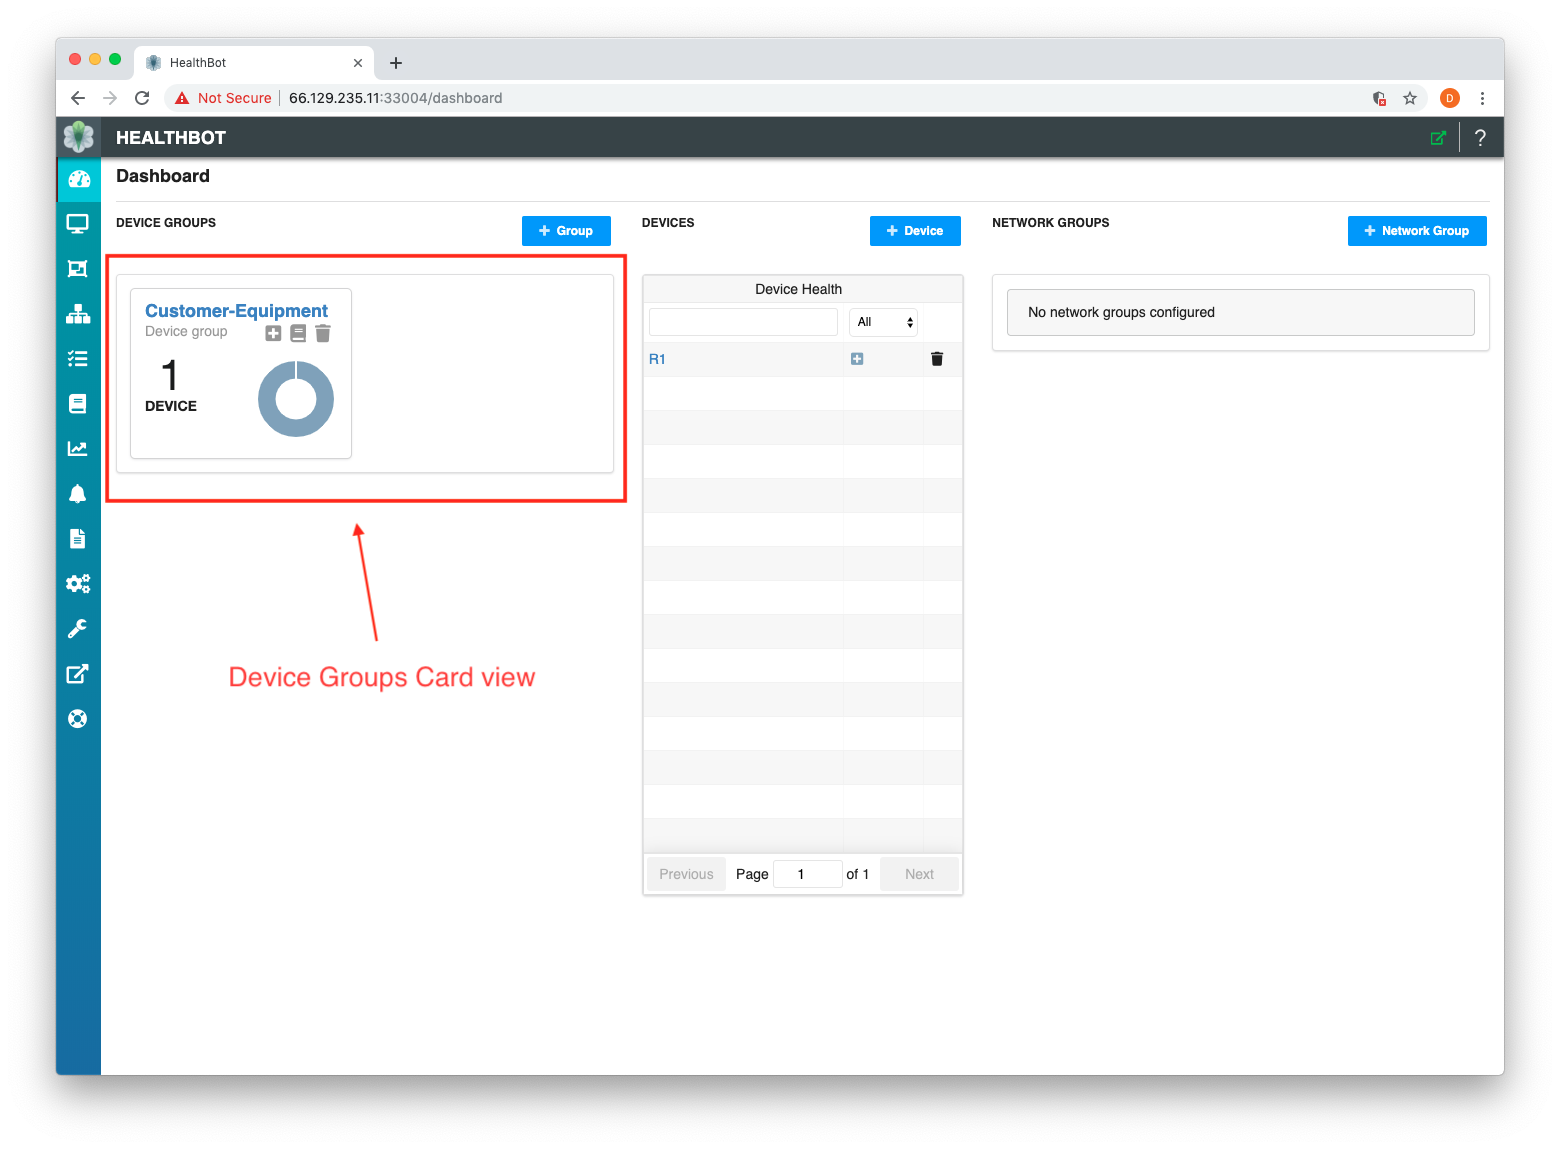
Note in the Devices Group Card View you can see a single entry for the Group you defined, in my case Customer-Equipment.
Instantiate
Internally Healthbot uses concepts such as Topics, Rules and Playbooks to define and categorize Key Performance Indicators for Devices, Networks or functions as well as how the system should react in the event of an incident. In this stage we will map the KPIs that we are interested in, against the Device Grouping we created in the previous stage.
To map KPIs against our Device Group we created in the previous stage, navigate to the Playbook page and find the System KPIs playbook and select the Apply button for this playbook.
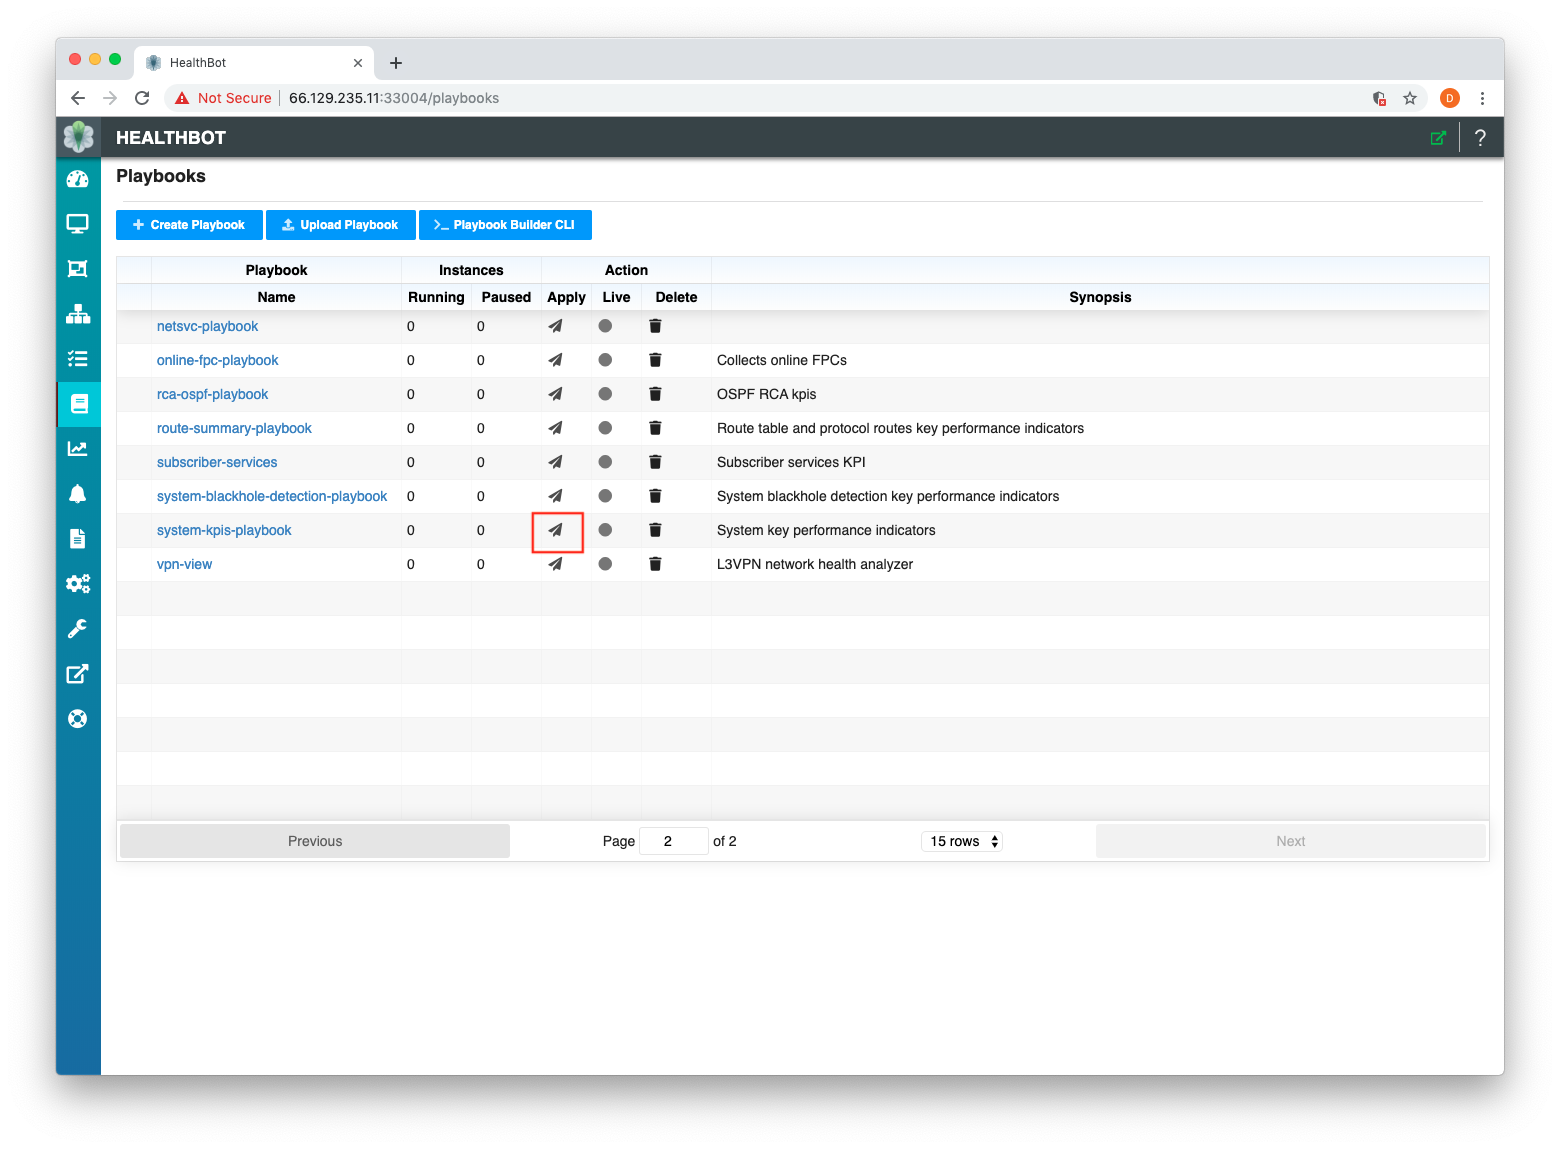
This will open a pop-up window as below. At this point you need to provide the following information about your Device Group:
Name of Playbook Instance: CE-System-Playbook
Device Group: Customer-Equipment
Assuming your Device is a JUNOS Device, the remaining information can be left as default.
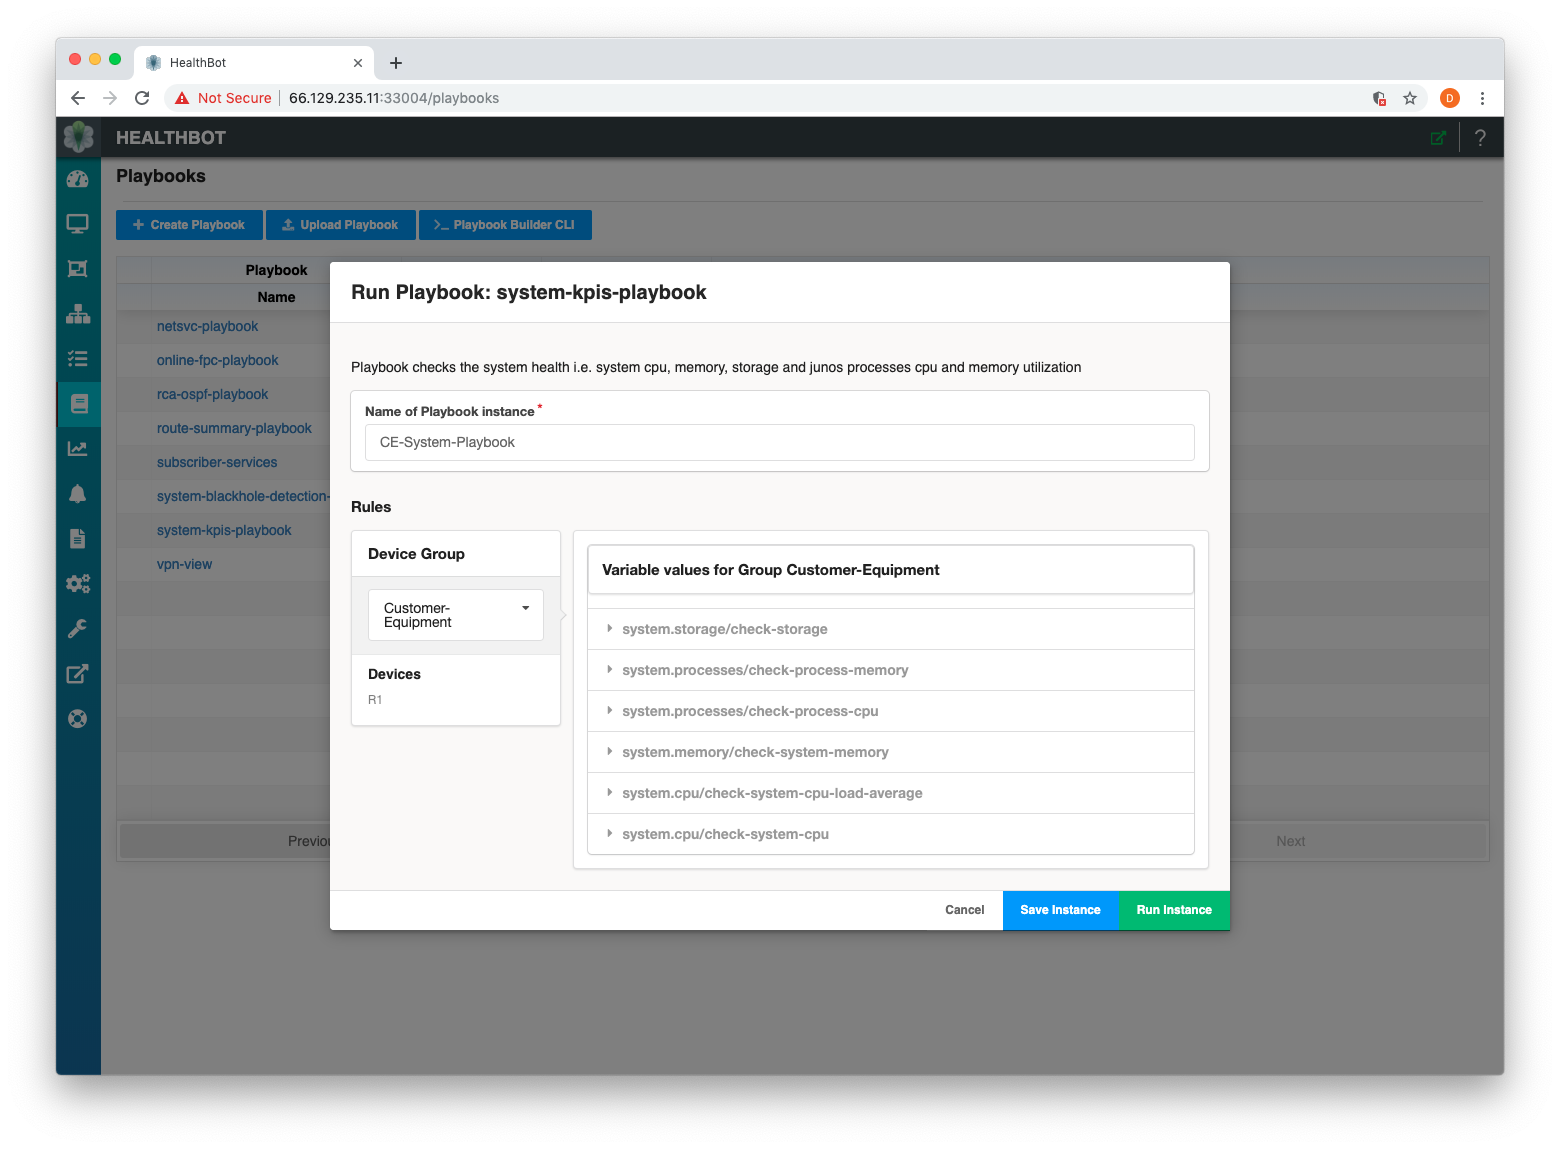
At this point go ahead and select Run Instance. Assuming everything worked ok you should now see a screen as follows:
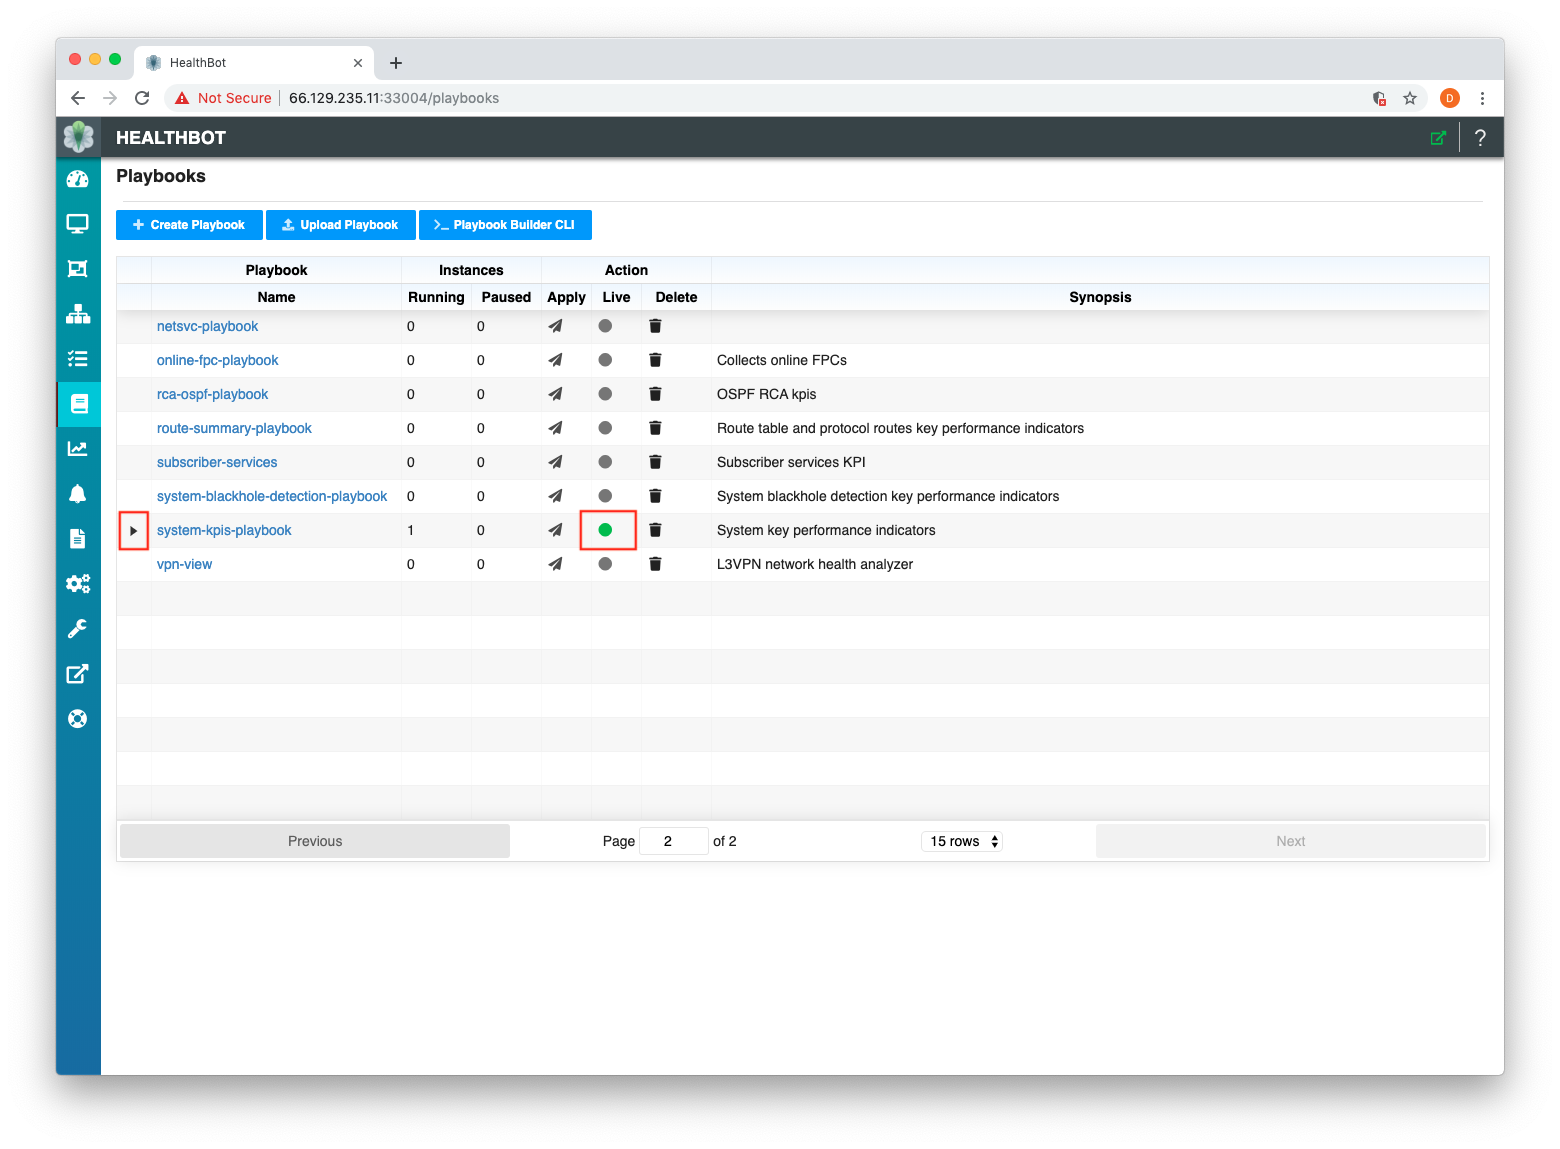
Note the caret on the left that can be expanded to show additional information about the running playbook instance and the traffic light indicator on the right showing that the instance is executing as expected.
Monitor
Finally, we confirm that the solution has been configured correctly by viewing the Device Group / Device Monitor screen and identifying any issues that require a resolution.
To view the Health (based on our chosen KPIs) of the Device Group we defined previously, navigate to the Device Group Health page and select your Device Group from the drop-down at the top left of the page and the specific Device your interested in from the drop-down below the chosen Device Group.
Device Group drop-down: Customer-Equipment
Device drop-down: R1
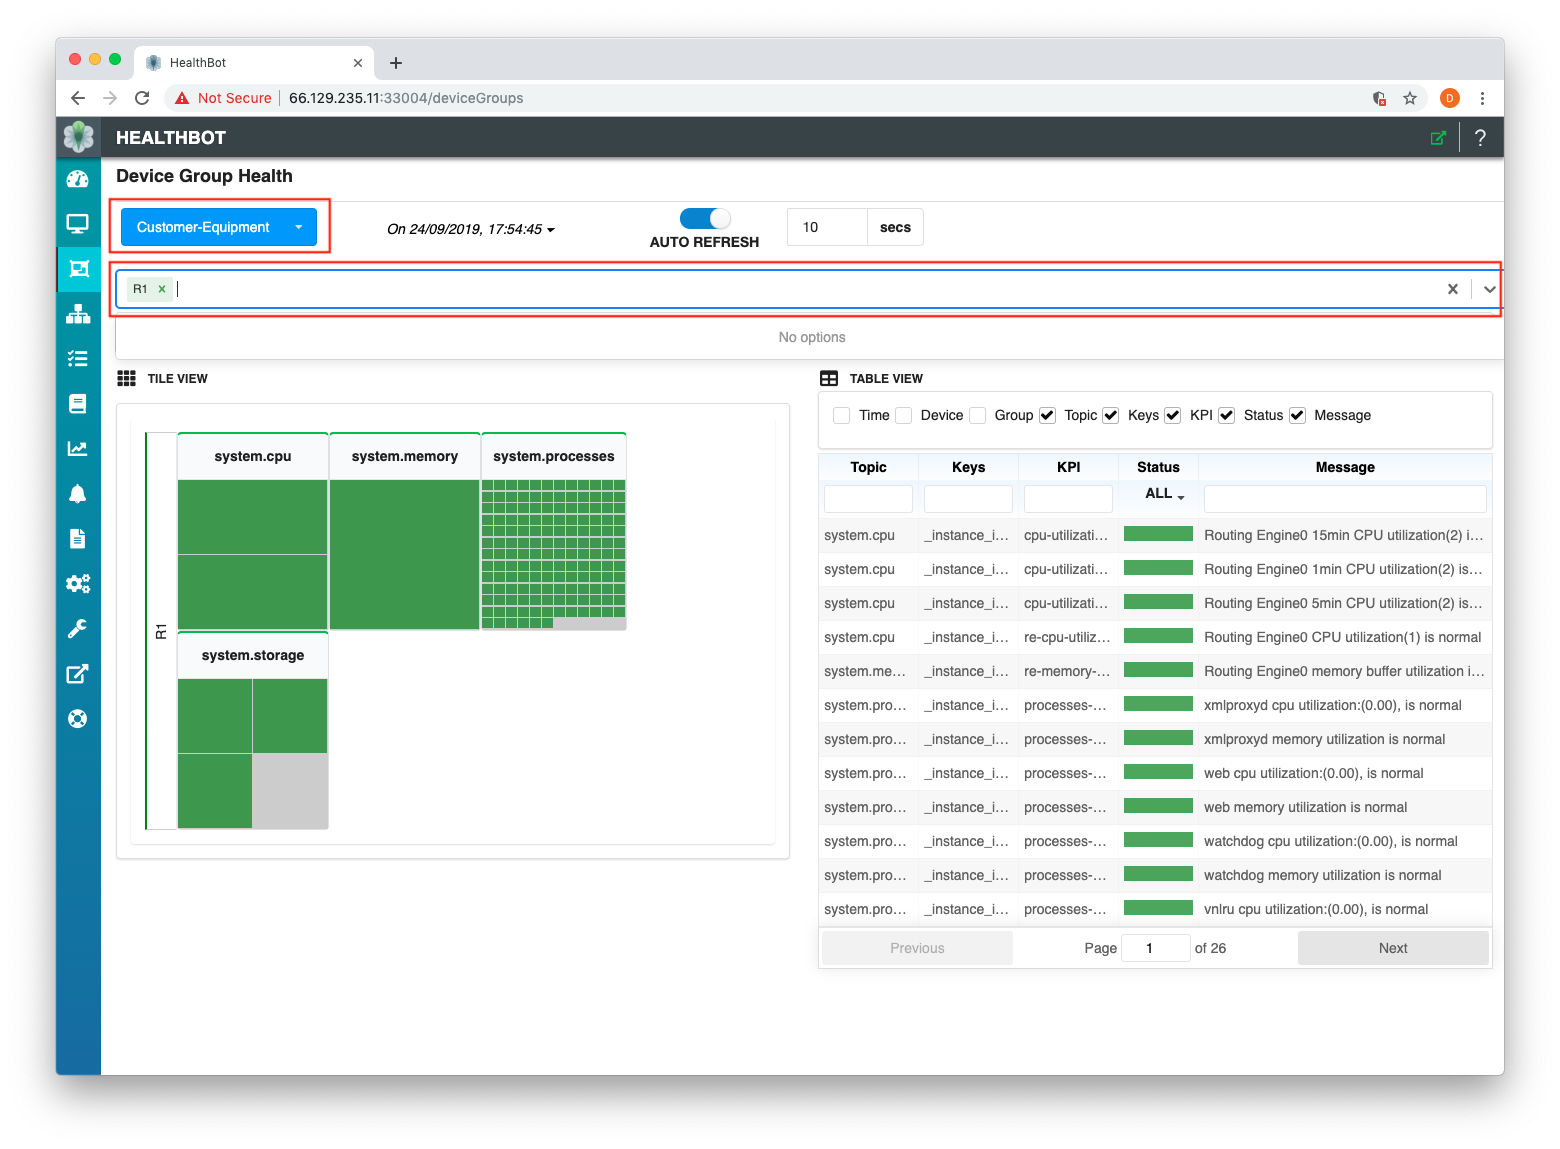
Note the two views that have been populated, the Tile View and the Table View.
The Tile View uses colored tiles(Red, Yellow, Green Gray) to allow you to monitor and troubleshoot the health of a Device. Green indicates that no problems have been detected.
The Table View allows you to monitor and troubleshoot the health of a single Device based on HealthBot data provided in a customizable table. You can see from the screenshot that the chosen Playbook includes information on System processes e.g. CPU Utilization.
Additional information is available in the Device, Device Group and Network Group section of the User Guide.